
The transparency premium in equity valuation is defined as the measurable valuation uplift investors assign to firms with superior disclosure quality, reflecting reduced information asymmetry and lower perceived investment risk. This concept extends well beyond ethical signaling. Transparency is a structural capital lever that compresses discount rates and improves cash-flow durability in ways that directly affect how analysts model terminal multiples and equity risk premiums. For institutional investors and analysts, understanding the transparency premium equity valuation relationship is the difference between identifying genuine mispricing and anchoring to a narrative that the market has already discounted.
What evidence supports the transparency premium in equity valuation?
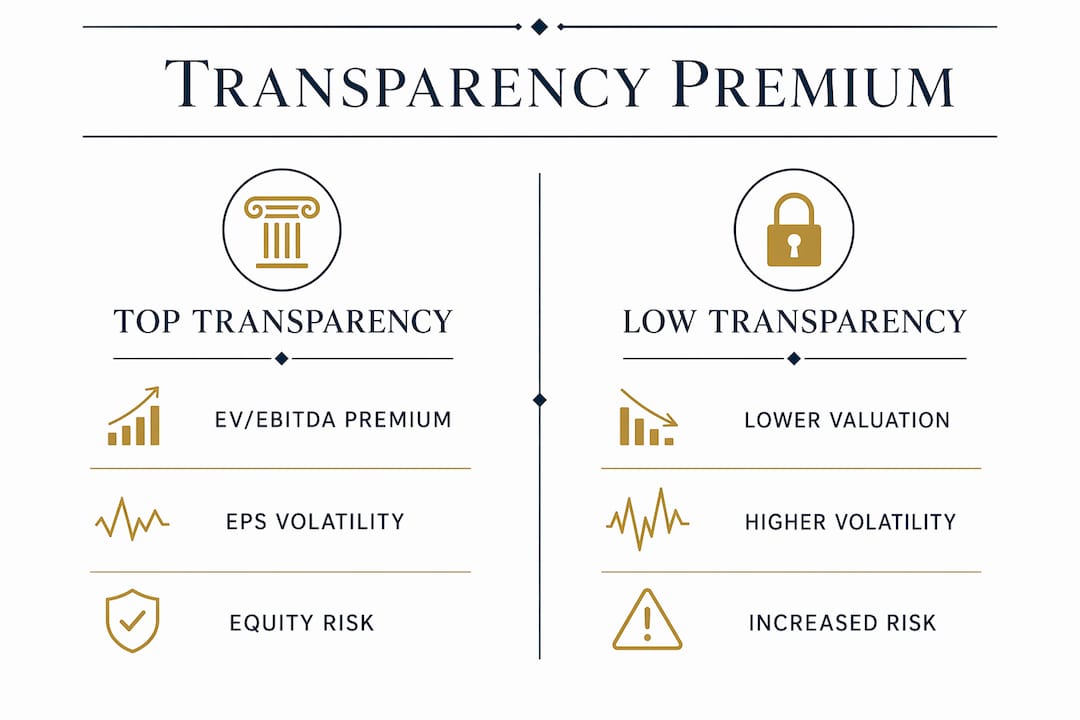
Top-quartile transparency firms trade at a 12–20% valuation premium on an EV/EBITDA basis compared to sector peers, based on empirical data spanning 2018–2025. That range is not trivial. A 15% premium on a $500 million EBITDA business represents $75 million or more in enterprise value, a figure that materially affects acquisition pricing, capital allocation, and portfolio construction decisions.
The same data set shows that top-transparency firms exhibit 10–15% lower EPS volatility relative to peers. Lower earnings volatility reduces the probability-weighted downside scenarios that analysts embed in discounted cash flow models, which mechanically increases present value. These two effects, multiple expansion and volatility compression, operate simultaneously and reinforce each other.

The table below summarizes comparative valuation metrics between transparency quartiles:
| Metric | Top-Quartile Transparency | Bottom-Quartile Transparency |
|---|---|---|
| EV/EBITDA Premium | 12–20% above peers | Baseline |
| EPS Volatility | 10–15% lower | Baseline |
| Equity Risk Premium Reduction | 25–75 basis points | None observed |
| Cost of Equity Reduction | 200–400 basis points | None observed |
| Institutional Ownership | Elevated | Suppressed |
The equity risk premium reduction of 25–75 basis points is particularly significant for long-duration assets. A 50 basis point compression in the discount rate applied to a firm with 15 years of projected cash flows can increase present value by 8–12%, depending on the growth profile. This is the mechanism through which disclosure quality becomes a valuation input, not merely a governance checkbox.
Pro Tip: When screening for transparency premium opportunities, prioritize firms that have recently upgraded their SEC filing granularity or expanded segment-level disclosure. These disclosure inflection points frequently precede institutional re-rating events that the broader market has not yet priced.
How does transparency affect risk, cost of capital, and equity risk premium?
Companies with robust disclosure frameworks reduce their cost of equity capital by 200–400 basis points through reduced information asymmetry. That reduction reflects a direct change in the risk investors perceive when modeling future cash flows. When a firm provides granular segment reporting, auditor attestation on internal controls, and consistent reconciliation between earnings call narratives and SEC filings, analysts can build tighter confidence intervals around their forecasts.
The mechanism works through several distinct risk channels that transparency addresses:
- Information asymmetry risk: Opaque disclosures force investors to apply a larger uncertainty buffer to their discount rates. Firms that close this gap through detailed financial reporting remove that buffer.
- Governance risk: Firms with strong ESG and governance practices experience fewer tail risks and lower discount rates, reflecting reduced probability of catastrophic governance failures.
- Earnings quality risk: Frequent, consistent disclosures reduce the probability that reported earnings diverge materially from economic reality, which compresses the earnings quality discount analysts apply.
- Liquidity risk: High transparency correlates with elevated institutional ownership, which improves secondary market liquidity and further reduces the liquidity premium embedded in discount rates.
- Regulatory risk: Firms with proactive disclosure practices face lower probability of SEC enforcement actions or restatement events, both of which trigger sharp valuation compression.
Analysts should distinguish the transparency premium from the ESG premium and the size premium. These three factors overlap but are not identical. A large-cap firm can have strong ESG scores but opaque financial disclosures. A small-cap firm can have exceptional disclosure quality but carry a legitimate size premium due to liquidity constraints. Transparency premiums require econometric modeling, not universal percentage add-ons, precisely because these factors interact differently across sectors and firm profiles.
Pro Tip: Separate your transparency adjustment from your ESG adjustment in the WACC build-up. Conflating them creates attribution errors that make it impossible to isolate which factor is driving valuation changes when either variable shifts.
What nuances and pitfalls arise when applying the transparency premium?
The transparency premium is not uniform across sectors, ownership structures, or disclosure regimes. Analysts who apply a fixed premium percentage across their coverage universe introduce systematic error into their valuation models. The following numbered framework identifies the most consequential pitfalls:
-
Sector variability. Capital-intensive industries such as utilities and industrials show stronger transparency premium effects than asset-light technology firms, where intangible asset disclosure gaps create different information asymmetry dynamics. Sector benchmarks are required inputs before any premium calibration.
-
Family ownership paradox. Family ownership positively correlates with firm-level transparency but negatively with market-level information quality. Korean-listed company data illustrates this paradox clearly. A family-controlled firm may produce detailed internal disclosures while simultaneously managing external communications in ways that reduce market trust. Crediting a full transparency premium to such firms overstates the valuation benefit.
-
Double-counting errors. Avoid double-counting transparency effects by separately analyzing discount rate compression and multiple expansion. Adjusting both the WACC and the terminal multiple for the same transparency factor inflates the valuation impact by applying the same benefit twice through different model inputs.
-
Dynamic premium reversal. Transparency premiums can disappear or invert if disclosures shift toward compliance-driven boilerplate or if the market anticipates a future transparency cliff. A firm that reduces disclosure granularity following a CFO departure or a strategic pivot should trigger an immediate premium reassessment.
The table below compares high-transparency and low-transparency firm profiles across key valuation dimensions:
| Dimension | High-Transparency Firm | Low-Transparency Firm |
|---|---|---|
| Disclosure consistency | Earnings call aligns with SEC filings | Narrative diverges from filed data |
| Auditor attestation | Strong internal control opinions | Qualified or limited attestations |
| Segment reporting | Granular, reconciled | Aggregated, limited detail |
| Institutional ownership | High | Low to moderate |
| Valuation multiple | Premium to sector | Discount or at-market |
How can analysts incorporate transparency premium into valuation models?
Practical integration of the transparency premium into equity valuation models requires a structured, multi-step approach rather than a single adjustment factor. The following framework reflects best practices for premium valuation analysis:
-
Transparency scoring overlay. Apply a quantitative transparency score to each coverage name, drawing on disclosure frequency, segment granularity, auditor attestation quality, and the degree of alignment between earnings call narratives and SEC filings. Use this score to adjust the equity risk premium in the WACC build-up, calibrated to the 25–75 basis point range supported by empirical data.
-
DCF volatility adjustment. Model reduced earnings volatility explicitly in the discounted cash flow framework. Firms in the top transparency quartile warrant a lower probability weight on adverse earnings scenarios. This adjustment should be documented separately from the discount rate change to avoid the double-counting error described above.
-
Scenario stress-testing. Build three transparency scenarios into each model: top-quartile disclosure quality, median disclosure quality, and disclosure deterioration. The spread between the top and bottom scenarios provides a quantified mispricing range that analysts can use to assess margin of safety.
-
Disclosure-delivery gap tracking. Tracking the disclosure-delivery gap between earnings call claims and SEC filings is a reliable predictor of valuation compression events. Firms where the narrative consistently outpaces filed data carry a latent opacity risk premium that the market has not yet fully priced.
-
Sector benchmark calibration. Use sector-specific transparency benchmarks rather than cross-sector averages. A transparency score that ranks in the 70th percentile for a financial services firm carries different valuation implications than the same score for a consumer staples company.
-
Econometric calibration over fixed percentages. Transparency premiums are risk measures that require defensible econometric models, not standardized add-ons. Document the regression inputs, control variables, and sector adjustments used to derive each premium estimate.
Pro Tip: Monitor proxy statement language alongside earnings call transcripts. Shifts in executive compensation disclosure detail or audit committee language frequently signal transparency inflection points six to twelve months before they appear in financial statement changes. These lead indicators create alpha opportunities for analysts who track them systematically.
Key takeaways
The transparency premium is a quantifiable, sector-sensitive valuation input that requires econometric calibration, scenario modeling, and continuous disclosure monitoring to apply with analytical rigor.
| Point | Details |
|---|---|
| Premium magnitude is material | Top-quartile transparency firms trade at 12–20% higher EV/EBITDA and show 10–15% lower EPS volatility. |
| Cost of capital impact is direct | Superior disclosure reduces cost of equity by 200–400 basis points through lower information asymmetry. |
| Double-counting is the primary modeling error | Adjust either the discount rate or the terminal multiple for transparency, not both simultaneously. |
| Ownership structure complicates attribution | Family-controlled firms may show firm-level transparency gains that do not translate to market-level credibility. |
| Disclosure-delivery gaps predict compression | Divergence between earnings call narratives and SEC filings is a leading indicator of valuation rerating risk. |
Why the transparency premium deserves more analytical rigor than it gets
Most analysts treat transparency as a qualitative overlay, something noted in the investment memo but rarely embedded in the model with the same discipline applied to revenue growth or margin assumptions. That treatment understates the premium's structural effect on valuation and creates systematic mispricing in coverage universes where disclosure quality varies widely.
The family ownership paradox is the most underappreciated nuance in this space. Firms with concentrated family stakes often produce detailed internal reporting while simultaneously managing external communications in ways that suppress market-level information quality. Crediting these firms with a full transparency premium because their filings are voluminous misses the distinction between disclosure volume and disclosure credibility. The market frequently prices this distinction correctly even when analysts do not.
The disclosure-delivery gap is the single most reliable signal I track for anticipating valuation compression. When a firm's earnings call narrative consistently outpaces what appears in its SEC filings, the gap is not a communication lag. It is a structural misalignment between what management claims and what the audit process can support. That misalignment eventually resolves, and it almost never resolves in the direction the narrative implied.
The practical implication is that transparency premium analysis should be a continuous monitoring function, not a one-time model input. Disclosure quality shifts. Audit committee composition changes. CFO transitions alter the tone and granularity of financial reporting. Analysts who treat the transparency premium as a static adjustment will systematically miss the inflection points where the premium compresses or expands.
— Glen
How Lacunaindex supports transparency premium analysis
Lacunaindex is built specifically for the analytical challenge described throughout this article: measuring the gap between corporate narrative claims and actual delivery using only public records. The platform's execution scoring methodology quantifies disclosure-delivery gaps across earnings calls, SEC filings, proxy statements, and press releases, producing the kind of systematic, evidence-based transparency scores that support defensible premium calibration.

Institutional analysts can use Lacunaindex sector benchmarks to calibrate transparency premiums against peer groups rather than relying on cross-sector averages that introduce attribution error. The Lacuna report guide walks analysts through the methodology for converting execution scores into WACC adjustments and terminal multiple overlays. For coverage universes where disclosure quality varies materially across names, Lacunaindex provides the forensic layer that transforms transparency from a qualitative note into a quantified valuation input.
FAQ
What is the transparency premium in equity valuation?
The transparency premium in equity valuation is the measurable increase in a firm's valuation multiple and reduction in its cost of equity that investors assign to companies with superior disclosure quality. Empirical data shows this premium reaches 12–20% on an EV/EBITDA basis for top-quartile transparency firms.
How does disclosure quality reduce the cost of equity?
Robust disclosure frameworks reduce information asymmetry between management and investors, which lowers the uncertainty buffer embedded in the equity risk premium. Research shows this reduction ranges from 200–400 basis points in cost of equity for firms with strong disclosure practices.
What is the disclosure-delivery gap and why does it matter?
The disclosure-delivery gap is the divergence between claims made in earnings calls and what appears in SEC filings. Analysts use this gap as a leading indicator of valuation compression, because persistent divergence signals that the corporate narrative is not supported by audited financial data.
How should analysts avoid double-counting the transparency premium?
Analysts should apply the transparency adjustment to either the discount rate or the terminal multiple, not both. Adjusting both inputs for the same transparency factor inflates the valuation impact by embedding the same benefit twice through different model mechanics.
Does family ownership affect the transparency premium?
Family ownership creates conflicting effects: it correlates positively with firm-level disclosure detail but negatively with market-level information credibility. Analysts should assess whether a family-controlled firm's disclosures translate into genuine market trust before crediting a full transparency premium in the valuation model.