
Forensic sector benchmarks compare companies' public narrative claims to measurable delivery using only public records, producing execution scores and sector-level gaps investors can act on. This is a distinct discipline from conventional peer indices: it measures whether what a company says matches what it does, and it lets institutional investors, governance professionals, and financial journalists prioritize scrutiny across a sector rather than one filing at a time. Lacuna Index publishes these comparisons as free sector benchmarks.
TL;DR:
- Sector-level benchmarks measure the gap between what companies publicly claim and their actual operational or financial results, using data from filings and transcripts.
- The analysis produces scores, narrative gap indices, and archetypes to identify potential misalignment, misconduct risk, or valuation discrepancies.
- Benchmarks are normalized against sector medians and supported by source-linked text analysis, ensuring transparency and reproducibility.
- They aid in early fraud detection, governance review prioritization, and investigative triage by filtering and reconstructing narrative-delivery gaps.
- Sector norms and disclosure patterns vary significantly, so interpretation must consider industry-specific contexts and potential genuine explanations for gaps.
Table of Contents
- What forensic sector benchmarks measure (and what they don't)
- Why these benchmarks matter to investors and governance teams
- How sector benchmarks are built: inputs, methods, and traceability
- Putting sector benchmarks to work: a screening and escalation workflow
- Where narrative gaps come from without fraud being involved
- How narrative gaps show up differently across sectors
- Normalizing scores so companies can be compared fairly
- How this compares to other benchmarking approaches
- Where sector benchmarking technology is headed
- The publisher's view: what Lacuna Index's benchmarks are built to do
- Get the sector view before you commission a forensic report
- Sources
What forensic sector benchmarks measure (and what they don't)
A forensic sector benchmark quantifies the distance between a company's stated commitments, whether from earnings calls, press releases, or proxy statements, and its subsequent operational or financial delivery, then places that measurement against peers in the same sector. It is not a substitute for the standard financial peer comparisons investors already run on revenue growth, margins, or valuation multiples. Those metrics answer "how did the company perform." Forensic benchmarks answer a different question: "did the company deliver on what it told the market it would do."
The distinction matters because a firm can post respectable numbers while its disclosure pattern shows systematic overstatement, walked-back guidance, or narrative that consistently outruns execution. Conventional sector benchmarking has no mechanism to catch that. Forensic benchmarking does, by working exclusively from public records rather than analyst models or management-supplied projections.
Typical outputs from this kind of analysis include:
- Execution scores measuring how consistently a company's stated plans translated into disclosed results
- Narrative gap indices quantifying the distance between promotional language and verifiable outcomes
- Archetype labels such as earned, borrowed, or undervalued, based on the relationship between execution and market valuation
Why these benchmarks matter to investors and governance teams
The evidence base for treating disclosure text as a signal, not just window dressing, has grown substantially. A large-sample analysis of 41,343 financial reports from U.S.-listed companies found that textual risk disclosures improve fraud-detection accuracy beyond what standard MD&A analysis catches, functioning as an early-warning layer that numeric ratios alone cannot detect.
Source matters too. Research on UK annual reports covering 2,437 narrative observations found that executive-authored narrative tone predicts future performance, while governance-section tone carries no such predictive power. That is a meaningful operating detail for anyone building or reading a benchmark: not all disclosure text is equally informative, and treating an earnings-call answer the same as boilerplate governance language will dilute the signal.
Practitioners use sector-level narrative gaps for several concrete tasks:
- Screening a sector for early fraud or misreporting risk before financial restatements surface
- Building a valuation overlay that flags "borrowed" narrative priced as if it were earned performance
- Triaging governance review and proxy voting priorities across a coverage list
- Generating investigative leads grounded in filing language rather than tips or rumor
How sector benchmarks are built: inputs, methods, and traceability
Every credible forensic benchmark starts from the same primary inputs: 10-K and 10-Q filings, earnings call transcripts, proxy statements, and press releases. These are chosen specifically because they are public, timestamped, and legally attributable. That last point is what makes the benchmark defensible under scrutiny. An execution score built from public filings can be checked by anyone with the same documents; a score built from private modeling or analyst chatter cannot.
The text-analysis layer typically combines several approaches:
- Topic modeling to identify what a company is actually talking about, since combining topical content with tone and disclosure-quality metrics outperforms tone analysis alone
- Tone and sentiment metrics tuned separately for executive versus governance authorship, given the predictive asymmetry noted above
- Contextual language models, including fine-tuned BERT architectures, which outperform earlier textual and quantitative fraud-detection benchmarks when applied to MD&A sections
- Risk-disclosure quality indicators mapped against SEC guideline categories, which function as early-warning signals in large-sample testing
From these inputs, the methodology produces sector medians and dispersion measures, individual execution scores, and archetype assignment based on where a company sits relative to both its narrative gap and its valuation. Thresholds for archetype boundaries are set from the sector's own distribution rather than an arbitrary cutoff, which keeps comparisons meaningful across sectors with very different disclosure norms. You can see how this framework applies to standard financial peer metrics on Lacuna's sector benchmark pages for financials.
Pro Tip: When reviewing any forensic score, check whether the provider links each data point back to the exact filing, paragraph, or transcript timestamp it came from. A score you cannot trace to source text is an opinion, not evidence.
Putting sector benchmarks to work: a screening and escalation workflow
A benchmark is only as useful as the workflow built around it. Institutional teams generally move through four stages, tightening the evidentiary bar at each step.
- Screen the sector. Set an execution-score threshold, then cross-reference against standard financial filters (leverage, margin trend, insider selling) to avoid flagging companies whose narrative gap is fully explained by a known restructuring or accounting change.
- Triage the flagged list. Rank by the size of the narrative gap and corroborate with a second data source, an auditor attestation footnote, a whistleblower report, or a prior regulatory inquiry, before treating the gap as meaningful.
- Reconstruct the case. For anything that survives triage, rebuild a timeline connecting specific promotional statements to specific delivery dates, so the gap is tied to identifiable claims rather than a vague pattern.
- Decide on escalation. Determine whether the finding supports a governance engagement letter, a formal disclosure request, or simply a place on a research watchlist pending the next reporting cycle.
This progression mirrors how forensic accounting literature recommends combining textual signals with human judgment: screening identifies candidates, while reconstruction and review establish whether engagement is warranted. Lacuna's proxy decision-making playbook walks through how to weight executive versus governance narrative sources at the triage stage.
| Workflow stage | Primary question | Typical output |
|---|---|---|
| Screen | Which sector peers show unusual execution scores? | Ranked shortlist |
| Triage | Does a second source corroborate the gap? | Confirmed candidates |
| Case review | What is the timeline behind the gap? | Documented evidence trail |
| Escalation | Does this warrant engagement or referral? | Governance action or watchlist entry |
Where narrative gaps come from without fraud being involved
Not every gap between promise and delivery signals misconduct. Organizational silos and fragmented accountability routinely produce contradictory disclosures even at well-run companies, since different business units often draft their own sections of a filing with no central reconciliation. Legacy commitments made under prior leadership, timing mismatches between when a plan was announced and when results were reported, and genuine strategic pivots can all generate a measurable gap with no deceptive intent behind it.
Model-side limitations compound the risk of misreading a gap: dictionary-based sentiment tools carry industry-specific bias, and coverage gaps in smaller-cap disclosure text can skew scores. Before treating any single gap as evidence, cross-check it against a second source, rebuild the relevant timeline, and check for governance-level red flags rather than reading the score in isolation.
Pro Tip: Treat a wide narrative gap as a research question, not a verdict. The governance red-flag checklist is a useful second filter before escalating.
How narrative gaps show up differently across sectors
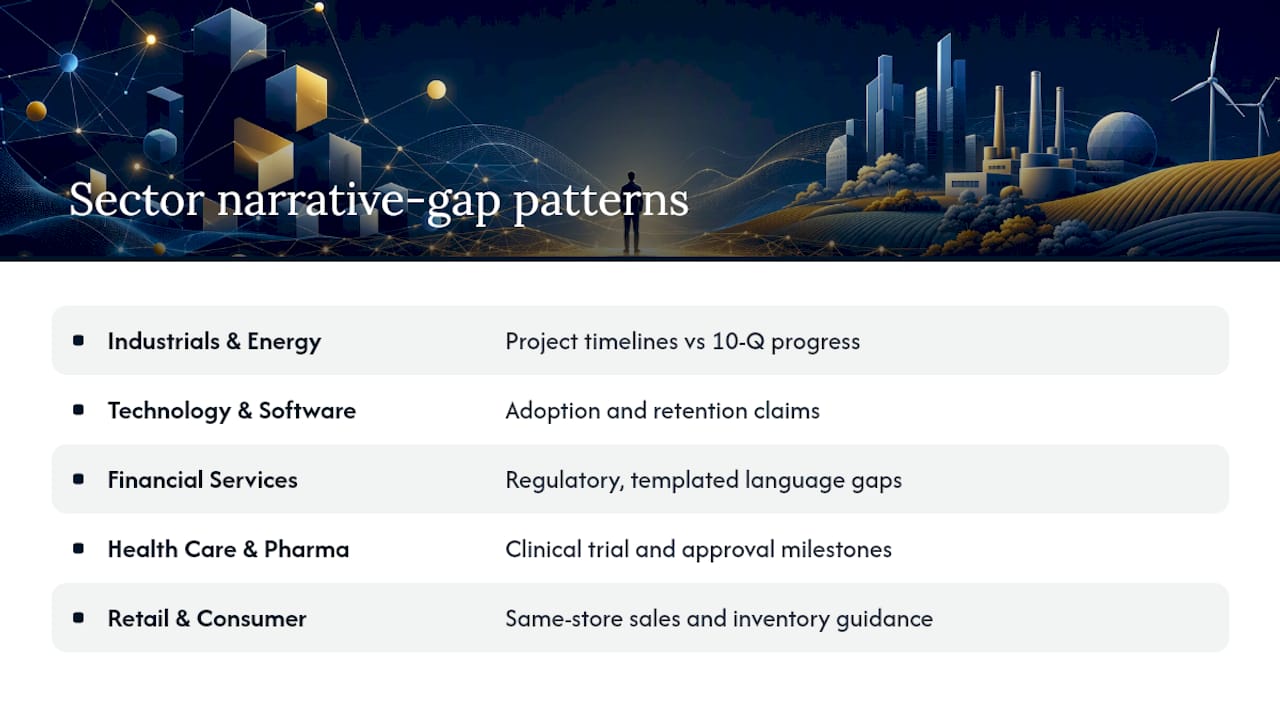
Disclosure norms vary enough by industry that the same execution score means something different depending on where a company sits. In capital-intensive sectors like industrials and energy, narrative gaps often cluster around project timelines: a company's earnings-call commentary on a capital expenditure program either lines up with subsequent 10-Q progress disclosures or it doesn't, and the gap is usually specific and datable.
In technology and software, the gaps tend to show up in adoption and retention language, forward-looking statements about customer growth that outpace what proxy statements and subsequent filings later confirm. Financial-sector disclosures carry their own texture: regulatory language is dense and heavily templated, so narrative gaps are often smaller in raw score terms but more consequential when they appear, since regulators and auditors are already reading the same text closely.
Health care and pharmaceuticals present a distinct pattern tied to clinical and regulatory milestones. Executive commentary on trial progress or approval timelines is unusually easy to check against subsequent public filings, which makes the sector a relatively clean testing ground for narrative-gap methodology. Retail and consumer companies, by contrast, often show gaps concentrated around same-store sales guidance and inventory commentary, areas where seasonal noise can widen a score without any underlying disclosure problem.
None of these patterns are absolute. They reflect how each sector's disclosure conventions shape where genuine narrative risk tends to concentrate, which is precisely why sector-level comparison, rather than a single cross-market score, is the more defensible unit of analysis.
Normalizing scores so companies can be compared fairly
Raw text metrics are not directly comparable across companies of different sizes, disclosure lengths, or industries, so normalization is where a forensic benchmark either holds up or falls apart. The standard approach anchors every company's execution score to the median and dispersion of its own sector rather than a market-wide baseline, which prevents a naturally verbose or heavily regulated industry from appearing systematically worse than a sector with terser disclosure habits.
Archetype boundaries, earned, borrowed, or undervalued, get set from that same sector distribution, using established methodology for evaluating narrative disclosure quality that accounts for readability, forward-looking content, and completeness of risk disclosure. Filing length itself gets adjusted for, since a longer 10-K is not automatically a more evasive one, and quarter-over-quarter comparisons are anchored to the same fiscal calendar position to avoid comparing a company's Q1 language to a peer's Q4 language.
The reproducibility standard matters as much as the math: every normalized score should trace back to the specific filing, transcript, or press release paragraph that produced it, so a governance team or auditor can rebuild the calculation independently rather than taking the output on faith.
How this compares to other benchmarking approaches
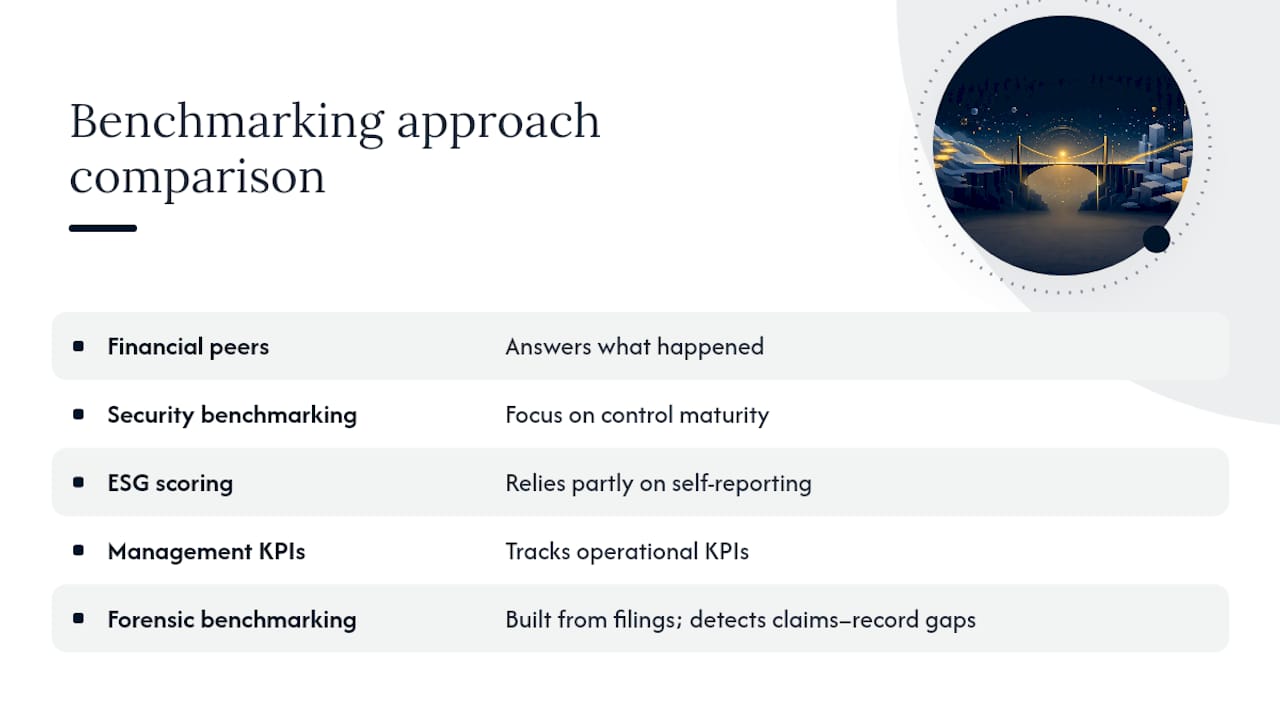
Financial peer benchmarking, the revenue, margin, and valuation comparisons most institutional teams already run, answers what happened. Sector-level security benchmarking approaches used in risk-management fields, by comparison, focus on control maturity rather than communication accuracy, an adjacent but separate discipline.
ESG scoring frameworks sit closer in spirit to forensic benchmarking, since both attempt to measure something beyond raw financial output, but most ESG methodologies rely partly on self-reported survey data or third-party questionnaires rather than exclusively on public filings. That reliance on self-reported input is the core structural difference: a forensic sector benchmark built only from SEC filings, earnings calls, and proxy statements cannot be gamed by a company simply answering a survey more favorably, because there is no survey to answer.
General business performance metrics frameworks, the kind used across management consulting, typically track operational KPIs like efficiency ratios or customer metrics. Those are useful for internal management but were never designed to catch a gap between what leadership says publicly and what the record shows. Forensic sector benchmarking fills that specific gap, and it does so by design rather than as a byproduct of a broader scoring system.
Where sector benchmarking technology is headed
Contextual language models have already moved the field past simple word-count sentiment scoring, and the trajectory points toward finer-grained attribution: distinguishing which specific executive or department authored a given passage, and weighting it accordingly, given how differently executive versus governance narrative tone predicts performance.
Expect tighter integration between textual signals and structured numeric data, ensemble models that read a risk-disclosure paragraph alongside the balance sheet line it references, rather than treating text and numbers as separate analytical tracks. Real-time processing of earnings calls is also becoming more standard, letting sector benchmarks update within days of a call rather than waiting for the next quarterly filing cycle. The direction of travel across all of it is the same: more granular attribution, faster refresh cycles, and tighter linkage between the score and the exact source text behind it.
The publisher's view: what Lacuna Index's benchmarks are built to do
Sector benchmarks can provide institutional readers with a free, sector-level starting point before any paid engagement: execution scores, narrative gap indices, and archetype classifications, traceable to the public filing, call, or statement behind each figure. Those who need to go further may use gated forensic reports for company-level detail, full evidence traces, and paragraph-by-paragraph sourcing that a sector-level view cannot show.
— Glen
Get the sector view before you commission a forensic report
Lacuna Index gives institutional readers a free, sector-wide starting point that a standard financial peer comparison cannot: a narrative-versus-delivery view, sourced entirely from public filings, that flags where a company's story and its record diverge before you spend a research budget confirming it yourself.

The public sector benchmarks page shows execution scores, narrative gap indices, and archetype labels across covered sectors at no cost, useful for an initial screen or for building a proxy-season watchlist. When a company's benchmark position warrants a closer look, the gated forensic report adds the company-level detail a sector view cannot: line-by-line evidence traces, filing citations for every score component, and the full timeline behind the narrative gap. If your team needs sector-level context before committing analyst time to a specific name, start with the public benchmarks page and request access to the underlying forensic report from there.
Sources
The large-sample study behind much of this article's evidence base examined 41,343 financial reports for textual fraud signals. The tone-authorship research comes from a study of executive versus governance narrative predictive power, and the modeling advances draw on BERT-based fraud detection research. For methodology background specific to Lacuna's own approach, see the sector benchmark reporting guide.
- Accounting fraud detection through textual risk disclosures in annual reports: From the perspective of SEC guidelines
- Executives vs. governance: Who has the predictive power? Evidence from narrative tone