
Sector benchmark corporate performance reporting is the practice of measuring a company's financial and operational metrics against sector-specific standards to determine whether reported results reflect genuine execution or engineered narrative. The industry term for this discipline is benchmarked performance assessment, and it sits at the intersection of financial analysis, governance review, and disclosure forensics. Corporate finance professionals use frameworks such as EBITDA margin comparison, working capital efficiency ratios, and execution scores to contextualize results that would otherwise appear in isolation. Excess working capital across S&P 1500 companies stands at $1.7 trillion, a figure that only becomes meaningful when measured against sector medians. Without a sector reference point, analysts cannot distinguish operational distress from deliberate capital allocation choices.
What data and prerequisites does sector benchmark reporting require?
Effective benchmarking begins with data architecture, not analysis. Analysts need two categories of input: internal financial data (income statements, balance sheets, cash flow statements, and operational KPIs) and external reference data (sector medians, quartile distributions, and index scores from sources such as the KPMG Financial Performance Index, S&P datasets, and public filings).

Disconnected data silos undermine corporate performance management at the foundation. Integrated ERP, CRM, and HR data streams are necessary for comprehensive benchmarking inputs. Without cross-functional data integration, analysts work with partial pictures that produce misleading comparisons.
Standardized metric definitions are equally critical. EBITDA margin, return on invested capital (ROIC), days sales outstanding (DSO), and free cash flow yield must carry identical definitions across reporting periods and peer companies. A single inconsistency in DSO calculation, for example, can shift a company from the second quartile to the third, altering the entire risk assessment.
| Data Type | Primary Source | Common Quality Issue |
|---|---|---|
| Income statement metrics | SEC filings, earnings releases | Non-GAAP adjustments vary by company |
| Working capital ratios | Balance sheet disclosures | Timing differences in period-end reporting |
| Sector median benchmarks | S&P datasets, index providers | Lagged publication cycles |
| Operational KPIs | Earnings call transcripts, proxy statements | Inconsistent definitions across peers |
| Narrative disclosures | Press releases, management commentary | Qualitative, requires structured extraction |
Pro Tip: Before running any comparison, build a metric definition register. Document exactly how each ratio is calculated for your company and for each peer. This single step eliminates the most common source of benchmarking error.
How to conduct sector benchmarking step by step
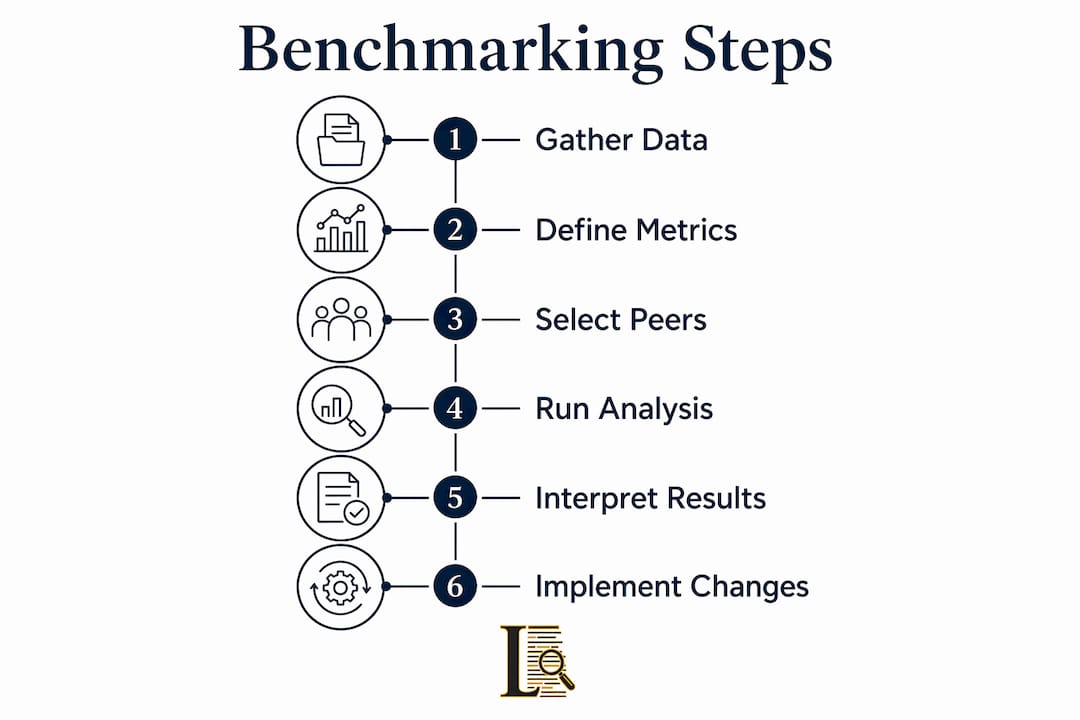
A structured sequence separates reliable benchmarking from ad hoc ratio analysis. The following six steps reflect the methodology applied in forensic performance assessment.
-
Define sector-relevant performance metrics. Select metrics that reflect the operating model of the sector. Capital-intensive industries prioritize ROIC and asset turnover. Consumer-facing sectors weight gross margin and inventory turnover. Financials require net interest margin and tier-one capital ratios.
-
Collect and validate source data. Pull financial statements from SEC filings, earnings releases, and proxy statements. Cross-reference figures across documents to detect restatements or reclassifications. Validate that peer company data uses the same reporting period.
-
Standardize metrics and calculate ratios. Normalize all figures for non-GAAP adjustments. Calculate key ratios consistently across the full peer set. Apply the same working capital formula to every company in the comparison group.
-
Map results to sector benchmarks. Position each metric against the sector median, the 25th percentile, the 75th percentile, and the top decile. External benchmarking identifies systemic risks that internal strategy analysis cannot reveal. A company performing at the 30th percentile on free cash flow conversion may reflect a sector-wide compression, not a firm-specific failure.
-
Analyze trends and deviations. Compare current period results to prior periods and to sector trend lines. A company whose EBITDA margin is contracting while the sector median is expanding signals a firm-specific execution problem. Industrial production growth reached its highest rate since august 2022 as of february 2026, meaning sector-level tailwinds must be factored into any deviation analysis.
-
Interpret results and integrate into reporting. Translate benchmark positions into narrative context for performance reports. A quartile ranking without interpretation is data, not insight. Analysts must explain what the deviation means for capital allocation, credit risk, or governance posture.
| Benchmarking approach | Metric focus | Appropriate use case |
|---|---|---|
| Quartile ranking | Relative position within sector | Peer comparison and governance review |
| Absolute score index | 0–100 scale reflecting financial health | Cross-sector and longitudinal tracking |
| Trend deviation analysis | Period-over-period metric movement | Early warning and distress detection |
| Narrative gap analysis | Execution versus stated commitments | Disclosure forensics and credibility scoring |
Pro Tip: Run your benchmarking model on a rolling quarterly basis, not just at year-end. Dynamic quarterly benchmarking enables proactive detection of performance shifts before they appear in annual disclosures.
How to interpret and apply sector benchmark findings
Benchmark results require interpretation within the company's specific strategic context. A retailer reporting a 30th-percentile inventory turnover ratio during a deliberate safety-stock build reads differently from the same ratio at a company with no stated inventory strategy. Context determines whether a deviation signals risk or intent.
Investors in 2026 prioritize earnings durability and balance sheet strength, with sectors showing pricing power and demand visibility outperforming. This means benchmark interpretation must account for macro conditions, not just peer medians. A company at the sector median for EBITDA margin in a sector experiencing margin compression is actually outperforming on a risk-adjusted basis.
Absolute scores and relative quartile ranks serve different analytical purposes. Quartile ranks show competitive position. Absolute scores reveal whether the entire sector is deteriorating. The KPMG Financial Performance Index scores nearly 40,000 companies globally on a 0–100 scale. Analysts who rely only on quartile rank within that index may miss a scenario where the entire sector has shifted downward.
Narrative analysis adds a qualitative dimension that quantitative benchmarks cannot capture alone. Management tone analysis compares forward-looking commitments in earnings calls with actual execution results. When a company consistently promises margin expansion and delivers contraction, the aspiration-to-execution gap becomes a measurable risk factor. Lacunaindex applies this methodology systematically, classifying companies as earned, borrowed, or undervalued based on the relationship between disclosed narrative and delivered results.
Best practices for applying benchmark findings:
- Pair every quartile rank with the absolute metric value to avoid masking sector-wide deterioration.
- Flag any metric where the company's trend diverges from the sector trend for three or more consecutive periods.
- Incorporate public company accountability benchmarks alongside financial ratios to assess disclosure quality.
- Distinguish between metrics driven by management decisions and those driven by external conditions.
- Document the interpretation rationale in the performance report so readers can assess the analytical judgment, not just the output.
Pro Tip: When a benchmark score looks surprisingly strong, check the underlying model. Logit-based indices can produce high scores from marginal improvements, just as they can produce near-zero scores from marginal declines. Always read the methodology notes.
Common mistakes in sector benchmark corporate performance reporting
The most damaging error in benchmarking practice is treating it as a retrospective, annual exercise. Experts recommend a dynamic quarterly feedback loop for timely insights and adaptive performance management. Annual benchmarking produces conclusions that are already 12 months stale by the time they reach decision-makers.
Overreliance on relative scores without examining absolute performance creates a second category of error. A company ranked in the top quartile of a distressed sector may still carry unacceptable absolute risk. The quartile rank obscures this reality unless analysts also track the absolute metric value over time.
A third common failure is ignoring the statistical mechanics of the benchmarking model itself. Benchmarking frameworks using logit models can bias scores toward extremes, producing misleading zero scores from marginal performance drops. Analysts who treat index scores as precise measurements without understanding the underlying model will misread the output.
Benchmarking without model literacy is like reading a map without knowing the scale. The direction may be correct, but the distance will always be wrong.
Additional errors that undermine benchmarking reliability:
- Using peer groups that are too broad or too narrow, diluting the sector signal.
- Failing to adjust for one-time items that distort period-over-period comparisons.
- Treating narrative disclosures as unstructured background rather than as structured data inputs.
- Skipping cross-functional data validation, which allows ERP and CRM inconsistencies to propagate into final ratios.
Pro Tip: Build a peer group review into your benchmarking calendar every two years. Sector composition shifts through M&A, spin-offs, and reclassifications. A stale peer group produces stale conclusions.
Key takeaways
Effective sector benchmarking requires integrated data, standardized metrics, and quarterly cadence to produce performance reporting that reflects actual execution rather than disclosed narrative.
| Point | Details |
|---|---|
| Data integration is foundational | Disconnected ERP, CRM, and HR silos produce incomplete benchmarking inputs and unreliable ratios. |
| Absolute scores complement quartile ranks | Quartile position alone masks sector-wide deterioration; always track the underlying metric value. |
| Quarterly cadence is required | Annual benchmarking produces conclusions that are 12 months stale before reaching decision-makers. |
| Narrative analysis extends quantitative benchmarks | Management tone and aspiration-to-execution gap analysis identify risks that financial ratios do not capture. |
| Model literacy prevents misinterpretation | Logit-based indices can produce extreme scores from marginal changes; understanding the model is non-negotiable. |
Why benchmarking without narrative context is incomplete analysis
I have reviewed corporate performance reports where the financial ratios looked sound and the quartile rankings were respectable. The company appeared to be performing at or above sector median on every standard metric. What the numbers did not show was a consistent pattern of management commitments that never materialized. Margin expansion promised for three consecutive quarters. Capex discipline announced and then quietly reversed. Working capital improvements attributed to operational excellence that turned out to be extended payables.
The quantitative benchmark told one story. The narrative record told another. The gap between those two stories is where actual risk lives, and it is the gap that most performance reporting frameworks never measure. Finance professionals who treat benchmarking as a ratio exercise are doing half the job.
The most useful benchmarking work I have seen integrates sector financial benchmarks with a structured review of disclosure patterns. That means reading earnings call transcripts against delivery records, not just comparing EBITDA margins to sector medians. Identifying high-risk narrative companies requires exactly this combination of quantitative position and qualitative execution tracking.
Benchmarking sophistication is not about adding more metrics. It is about asking whether the metrics you already have are being reported honestly. That question requires both the sector reference point and the narrative audit.
— Glen
How Lacunaindex supports sector benchmark analysis
Lacunaindex publishes sector-level financial benchmarks drawn entirely from public records, including SEC filings, earnings call transcripts, proxy statements, and press releases. These benchmarks give corporate finance professionals a consistent external reference point for evaluating whether reported performance reflects genuine execution or disclosure management.

The Lacunaindex user guide explains how to read execution scores, interpret aspiration-to-execution gap classifications, and apply sector benchmark data to performance reporting workflows. Analysts working across financials, consumer staples, utilities, and other sectors can access reference data organized by sector and metric category. For teams building or refining their benchmarking methodology, Lacunaindex reports provide a forensic baseline that standard financial databases do not offer.
FAQ
What is sector benchmark corporate performance reporting?
Sector benchmark corporate performance reporting is the practice of comparing a company's financial and operational metrics against sector-specific standards to contextualize results and identify execution gaps. It combines quantitative ratio analysis with external reference data to produce assessments that go beyond internal targets.
What metrics are most commonly used in sector benchmarking?
EBITDA margin, ROIC, DSO, free cash flow yield, and working capital efficiency ratios are the most widely applied metrics in sector benchmarking. The specific set varies by industry, with capital-intensive sectors weighting asset turnover and financials weighting net interest margin.
How often should sector benchmarking be conducted?
Benchmarking should run on a quarterly basis, not annually. Quarterly benchmarking enables proactive detection of performance shifts before they appear in year-end disclosures, giving analysts time to act on early warning signals.
Why do logit-based benchmarking indices produce misleading scores?
Logit models compress scores toward extremes, meaning a marginal performance decline can produce a near-zero index score that overstates distress. Analysts must read the methodology documentation for any index they use to avoid misinterpreting model artifacts as genuine performance signals.
How does narrative analysis improve sector benchmark reporting?
Management tone analysis compares forward-looking commitments in earnings calls against actual delivery records, adding a qualitative dimension that financial ratios alone cannot provide. This approach identifies the aspiration-to-execution gap, which is a measurable indicator of disclosure risk and potential market mispricing.