
Effective public filing cross-reference research techniques reduce to a short, reproducible checklist: pull EDGAR accession numbers, align the press release–transcript–10-K timeline, reconcile operating cash flow against reported net income, check Form 4 and 13D/G filings for insider activity, and compare MD&A language across periods for narrative drift. Any material divergence across those five axes warrants a scored evidence entry and a decision on escalation.
Quick checklist — copy into your workflow:
- Pull accession numbers for the target company's 10-K, 10-Q, 8-K, DEF 14A, and any S-1 from SEC EDGAR
- Build a disclosure timeline: earnings press release date → call transcript → 10-K/10-Q filing date
- Reconcile net income to operating cash flow; flag gaps exceeding one standard deviation from sector peers
- Run Form 4 and 13D/G checks for insider selling or activist accumulation within 30 days of material 8-K events
- Compare MD&A language quarter-over-quarter using XBRL-tagged text fields for narrative drift
- Document every finding with source URL, accession number, quoted excerpt, and a confidence score
Pro Tip: Start with the accession number, not the company name. EDGAR's full-text search (efts.sec.gov) returns every filing containing a specific term, which is faster than navigating the company page when you need to locate a specific disclosure event.
Key Takeaways
Systematic cross-referencing of SEC filings, transcripts, and external public records produces audit-traceable findings when each step is documented with accession numbers, quoted excerpts, and a scored confidence level.
| Point | Details |
|---|---|
| Start with accession numbers | Pull EDGAR accession numbers first; they are the canonical identifiers for reproducible retrieval. |
| Align the disclosure timeline | Map press release, call, and 10-K dates separately to isolate incremental narrative disclosures. |
| Combine ratio and narrative checks | Operating CF / net income divergence and MD&A cosine similarity together outperform either check alone. |
| Score every finding | Apply the three-band rubric (Monitor / Investigate / Escalate) before any external action or dissemination. |
| Lacunaindex scales the workflow | The platform delivers audit-traceable execution scores and sector benchmarks built from the same public-record sources. |
Table of Contents
- Which SEC filings should you cross-reference, and what does each reveal?
- What does a reproducible cross-reference workflow look like?
- What forensic techniques expose misrepresentation in filings?
- How do you triangulate filings with other public records?
- How should you document evidence and score findings for escalation?
- What are the legal and ethical limits of public-record cross-referencing?
- A representative cross-reference walkthrough
- How do you prioritize leads and decide when to escalate?
- Why systematic cross-referencing reduces false positives
- Lacunaindex operationalizes this workflow at institutional scale
- Primary sources and tools to bookmark
- Sources
Which SEC filings should you cross-reference, and what does each reveal?
Prioritizing sources by the type of claim they corroborate is the first discipline of systematic public filing analysis. The Brunswick Group 2026 Investor Survey confirms that investors still rely most heavily on primary company disclosures and that machine-readable formats (HTML, XBRL, full transcripts) materially improve discoverability for analytical workflows.
| Filing / Disclosure | Core Content | Red Flags It Corroborates |
|---|---|---|
| Form 10-K | Audited financials, MD&A, risk factors, footnotes | Revenue recognition policy changes, off-balance-sheet items, auditor changes |
| Form 10-Q | Quarterly unaudited financials, interim MD&A | Sequential margin compression, receivables build, cash-flow divergence |
| Form 8-K | Material events (earnings, restatements, leadership changes) | Timing of disclosure relative to insider trades |
| DEF 14A (Proxy) | Board composition, executive comp, related-party transactions | Pay-for-performance misalignment, undisclosed conflicts |
| S-1 | Registration details, use of proceeds, risk factors | Prospectus claims vs. post-IPO delivery |
| Form 4 | Insider buy/sell transactions | Selling ahead of negative disclosures |
| Forms 13D/13G | Activist or institutional stake changes | Undisclosed accumulation, governance pressure signals |
| Earnings press release | Non-GAAP metrics, forward guidance | Metric definition changes, selective emphasis |
| Earnings call transcript | Management narrative, analyst Q&A | Hedging language, unanswered questions, narrative reversals |
Pro Tip: XBRL inline viewer (viewer.fasb.org) lets you click any tagged financial figure in a 10-K and retrieve its exact taxonomy element — useful for confirming whether a company changed how it tagged a metric between periods, which is itself a disclosure-consistency signal.
What does a reproducible cross-reference workflow look like?
A replicable forensic workflow requires six discrete steps, each producing a documented output that a second analyst can verify from public records alone. Academic protocols for authenticity evaluation require 45–60 minutes per company at minimum, per ESG communication research — budget accordingly.
- Define the hypothesis. State the specific claim to test (e.g., "Revenue growth is overstated relative to cash collections") and identify the filing types most likely to contain corroborating or refuting evidence.
- Collect filings and accession numbers. Download the relevant 10-K, 10-Q, 8-K, proxy, and transcript. Record each accession number, filing date, and EDGAR URL in an evidence table.
- Build a disclosure timeline. Map press release date, call date, and 10-K/10-Q filing date. Firms frequently use staggered disclosure strategies — press release, then call, then 10-K — so the incremental narrative in each layer must be isolated separately.
- Reconcile numbers and narrative. Compare GAAP financials to non-GAAP metrics in press releases. Cross-check MD&A claims against footnote disclosures and auditor attestation language.
- Run forensic checks. Apply ratio analysis, Benford's Law, and narrative-text comparison (detailed in the next section).
- Document and score. Populate the evidence table; assign a confidence level and materiality band to each finding.
For versioning, snapshot each filing as a PDF with a timestamp and store the EDGAR accession number as the canonical identifier. This allows any downstream analyst to retrieve the identical document version.
What forensic techniques expose misrepresentation in filings?
Forensic accounting research shows that combining big-data analytics with behavioral and narrative signals outperforms purely numerical models in detecting financial reporting misconduct. The practical implication: ratio checks and text analysis belong in the same workflow, not separate ones.
| Technique | What It Detects | Key Metric or Signal |
|---|---|---|
| Ratio and trend analysis | Margin compression, receivables inflation, cash-flow divergence | Operating CF / Net income ratio; receivables turnover vs. revenue growth |
| Benford's Law | Digit-frequency anomalies in reported figures | First-digit distribution vs. expected log distribution |
| Anomaly detection / clustering | Outlier transactions, unusual accrual patterns | Accrual ratio; Jones model discretionary accruals |
| Related-party network analysis | Undisclosed revenue routing, circular transactions | Footnote entity cross-reference; 13D/proxy overlap |
| Narrative NLP / text comparison | MD&A drift, hedging language shifts, claim reversals | Cosine similarity between quarterly MD&A sections |
A systematic review of 43 studies (2010–2024) identifies machine-learning classifiers, anomaly detection, and network analyses as the most effective categories for financial-statement fraud detection, while noting that interpretability and data governance remain material challenges. That finding argues for human validation at every automated output stage, not just at the conclusion.
Ratio analysis can produce fingerprints of manipulation when linked to contemporaneous disclosures, and those fingerprints can meet litigation pleading standards when paired with documented explanations from management. — Veritas Financial Analytics
How do you triangulate filings with other public records?
Filing-based inferences gain or lose credibility depending on whether external public records corroborate them. The triage logic below maps hypothesis type to the most productive first external source:
- Governance concern (board independence, pay-for-performance): start with the DEF 14A, then cross to state business filings (Delaware Secretary of State, for example) to verify officer/director histories and any undisclosed affiliations.
- Revenue quality concern: cross-reference earnings press release non-GAAP definitions against 10-K footnotes, then check supplier or customer mentions in 10-K risk factors and any publicly available contract filings on state procurement databases.
- Insider activity concern: map Form 4 transaction dates against 8-K event dates; check whether sales preceded negative disclosures by fewer than 30 days.
- Operational claim concern (headcount, capacity, geographic expansion): cross-reference job postings on LinkedIn or Indeed against stated hiring plans in the 10-K MD&A; patent filings on USPTO.gov against claimed R&D milestones.
- Litigation risk: PACER (federal court dockets) and state court databases surface active or settled cases not yet disclosed in 8-K or 10-K risk factors.
- News archive corroboration: Factiva or ProQuest archives provide contemporaneous press coverage that can confirm or contradict the timing of management claims.
Misalignment scenarios are most diagnostic when two independent external sources converge on the same discrepancy. A single external source that conflicts with a filing may reflect a data lag; two independent sources pointing the same direction raise the confidence level materially.
How should you document evidence and score findings for escalation?
An audit-traceable evidence table is the output that converts a cross-reference finding into a governance or investment action. Institutional ESG research teams using 10–50 person teams apply standardized protocols precisely because ad hoc documentation fails reproducibility tests under scrutiny.

| Column | Content |
|---|---|
| Source URL / Accession | EDGAR URL + accession number (e.g., 0001234567-24-000001) |
| Filing type and date | 10-K, Q3 2024, filed November 8, 2024 |
| Quoted excerpt | Verbatim passage with page/section reference |
| Numeric reconciliation | Stated figure vs. cross-referenced figure; delta and direction |
| Confidence level | High / Medium / Low (based on corroboration count) |
| Replication steps | Numbered retrieval steps a second analyst can follow |
Scoring rubric — materiality and escalation bands:
- Score 1 (Monitor): Single-source anomaly, no corroboration, delta below 5% of reported metric. Action: log and re-check next filing cycle.
- Score 2 (Investigate): Two-source corroboration, delta 5–15%, or one governance flag (e.g., related-party disclosure gap). Action: extend ratio analysis; prepare IR questions.
- Score 3 (Escalate): Three or more corroborating sources, delta above 15%, or insider activity aligned with the anomaly. Action: brief portfolio manager or governance committee; consider regulatory referral.
A forensic financial analysis methodology that maps each finding to a score band produces a defensible, replicable record — the standard required for litigation support or regulatory submission.
What are the legal and ethical limits of public-record cross-referencing?
Public filings are, by definition, public. Cross-referencing them carries no inherent legal risk. The constraints arise at the edges: how findings are communicated, what inferences are drawn, and whether any nonpublic information was incorporated.
Before disseminating a finding publicly, confirm that the analysis rests entirely on public records, that no material nonpublic information (MNPI) was received in connection with the research, and that any fraud allegation is framed as an inference supported by documented evidence rather than a stated fact. Defamation exposure increases sharply when a published report asserts fraud as established rather than as a hypothesis supported by specific, cited evidence. The distinction between "the data is consistent with revenue inflation" and "the company committed fraud" is legally material.
Key guardrails:
- Insider trading: receiving MNPI — even inadvertently through an IR call — can taint a public-record analysis. Maintain a clean-team protocol and log all information sources.
- Defamation risk: frame findings as evidence-supported inferences, not conclusions of fact, until a legal or regulatory body has adjudicated the matter.
- Fair use and data licensing: EDGAR data is public domain; Compustat and CRSP data carry licensing restrictions on redistribution.
- Confidentiality: some institutional mandates require pre-clearance before publishing findings on portfolio companies.
Pro Tip: Consult compliance or outside counsel before publicly disseminating any report that names a specific company and characterizes its disclosures as potentially misleading. The evidentiary standard for a governance memo differs from the standard for a published report.
A representative cross-reference walkthrough
Hypothesis: A mid-cap industrial company's reported revenue growth is inconsistent with cash collections and working-capital trends.
- Collect filings: 10-K (accession 0001234567-24-000001), Q3 10-Q (accession 0001234567-24-000089), Q3 earnings press release (8-K, accession 0001234567-24-000075), and earnings call transcript from the IR page.
- Build timeline: press release October 28, 2024; call October 29, 2024; 10-Q filed November 8, 2024.
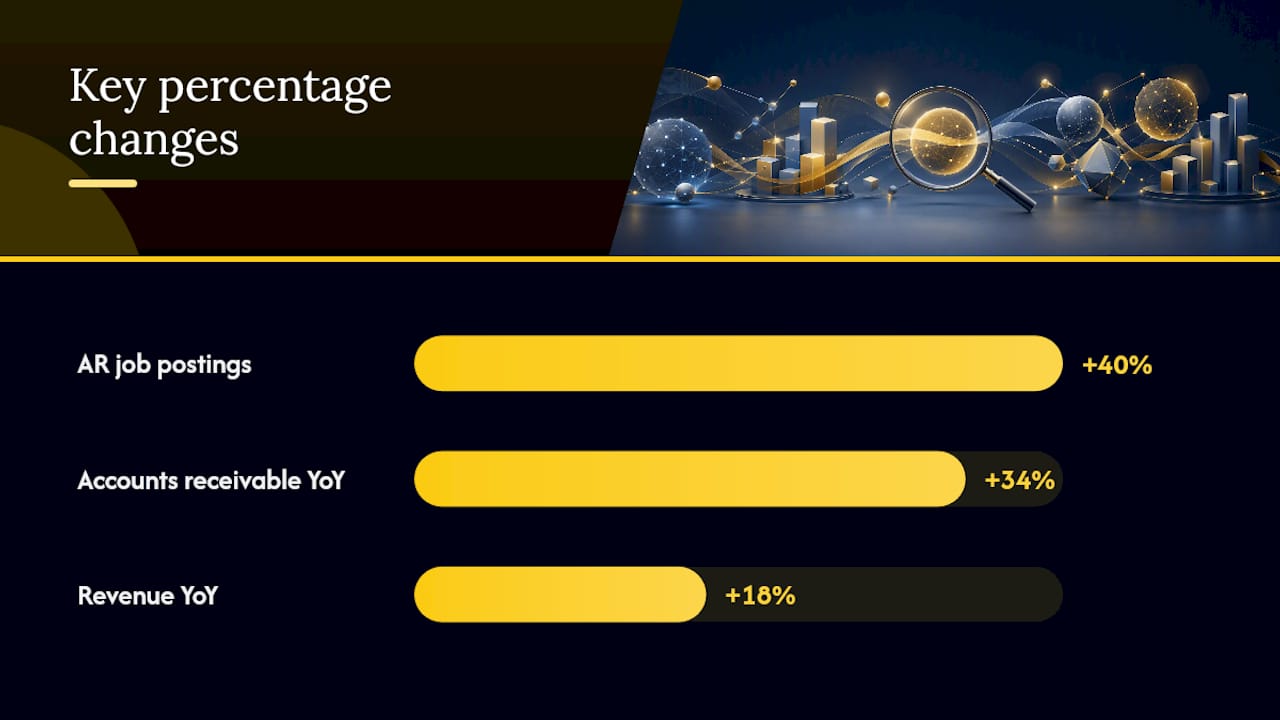
- Reconcile: reported revenue +18% YoY; accounts receivable +34% YoY; operating cash flow flat. Days Sales Outstanding expanded from 52 to 71 days.
- Forensic checks: Benford's Law applied to quarterly revenue figures shows a modest excess of 4s and 5s in the leading digit. MD&A in Q3 10-Q omits the DSO expansion mentioned in Q2; call transcript contains one analyst question on collections that management deflected without a numeric answer.
- Cross-source: no new major customer contracts in state procurement databases; job postings for accounts-receivable roles increased 40% in the same period.
| Evidence Item | Source | Confidence | Score |
|---|---|---|---|
| DSO expansion 52→71 days | 10-Q, p. 14, accession …000089 | High | 3 |
| CF / NI ratio below 0.6 | 10-K, cash-flow statement | High | 3 |
| MD&A omission of DSO trend | Q3 10-Q vs. Q2 10-Q comparison | Medium | 2 |
| Deflected analyst question | Earnings call transcript, Oct 29 | Medium | 2 |
| AR-role job postings surge | LinkedIn / Indeed, Oct 2024 | Low | 1 |
Composite score: 3 (Escalate). Recommended action: prepare a structured IR inquiry and brief the portfolio manager. Lacunaindex's execution-scoring methodology maps directly to this rubric: the platform quantifies the aspiration-to-execution gap using the same filing sources and produces an audit-traceable score that governance teams can reproduce independently.
How do you prioritize leads and decide when to escalate?
Most cross-reference workflows surface more anomalies than can be pursued simultaneously. Triage on four axes:
- Materiality: does the delta affect a metric that drives valuation (revenue, gross margin, free cash flow)? Prioritize findings where the reconciliation gap exceeds 10% of the affected line item.
- Corroboration: how many independent sources confirm the anomaly? A finding corroborated by three sources (filing, transcript, external record) outranks one with a single source regardless of the delta size.
- Insider activity: Form 4 sales within 30 days of a material 8-K, or 13D accumulation preceding a governance push, elevate any associated finding by one score band.
- Narrative persistence: a claim that appears in three consecutive earnings calls but is absent from the corresponding 10-K MD&A sections signals deliberate disclosure opacity.
Escalation flow:
- Score 1: log, monitor next cycle, no external action.
- Score 2: draft IR questions; request contemporaneous documentation (board minutes, audit committee reports where publicly available).
- Score 3: brief portfolio manager or governance committee; consider engagement with the board's audit committee chair; evaluate whether SEC whistleblower submission is warranted.
Sample IR questions for a Score 2 or 3 finding: "Can management explain the divergence between reported revenue growth and operating cash-flow generation in Q3?" and "What drove the 19-day expansion in Days Sales Outstanding, and what collection actions are underway?"
Why systematic cross-referencing reduces false positives
The instinct in forensic equity research is to treat every anomaly as a signal. That instinct produces false positives at a rate that erodes credibility with governance committees and portfolio managers. The discipline that separates a reproducible finding from a speculative one is corroboration: the requirement that at least two independent public sources point in the same direction before a finding advances beyond the monitoring stage.
Three practical lessons from applying this methodology at scale. First, the timeline step is the most frequently skipped and the most consequential. Firms that stagger disclosures can cause a narrative gap between the press release and the 10-K that looks like concealment but is actually a function of disclosure sequencing — empirical work on staggered disclosure makes this distinction essential. Second, ratio analysis is most powerful when it produces a multi-period fingerprint rather than a single-quarter flag; one anomalous quarter has many explanations, but four consecutive quarters of operating cash flow running below net income narrows the hypothesis set considerably. Third, narrative NLP checks are underused relative to their signal value — MD&A cosine similarity across eight quarters surfaces language drift that numeric analysis misses entirely.
Lacunaindex operationalizes this workflow at institutional scale
Cross-referencing public filings manually is reproducible but time-intensive. Lacunaindex applies the same forensic methodology — EDGAR/XBRL sourcing, timeline alignment, ratio reconciliation, and narrative scoring — systematically across public companies, producing audit-traceable execution scores and sector benchmarks that governance teams and portfolio managers can act on directly.

Three concrete advantages for institutional workflows: the platform's forensic reports carry full source citations (accession numbers, filing dates, quoted excerpts), so findings meet the evidentiary standard for governance escalation without additional documentation work. Sector benchmarks provide the peer context needed to distinguish company-specific anomalies from industry-wide trends. And the execution score quantifies the aspiration-to-execution gap in a single, comparable metric across coverage universes.
Explore sector benchmarks for free, or request access to company-level forensic reports to integrate Lacunaindex's scoring into your due diligence workflow.
Primary sources and tools to bookmark
- SEC EDGAR full-text search — canonical source for all U.S. public filings; free, authoritative, machine-queryable via XBRL API
- SEC EDGAR company search — navigate by CIK or ticker to retrieve filing histories and accession numbers
- Compustat — standardized fundamentals database for ratio computation and peer benchmarking
- CRSP — historical U.S. equity returns for event-study windows around disclosure dates
- LSEG Workspace — institutional ownership data, news archives, and analyst estimates
- Lacunaindex sector benchmarks — free public valuation reference and execution-score benchmarks by sector
- Lacunaindex forensic analytics — company-level forensic reports with audit-traceable execution scores and narrative-versus-delivery analysis
- Alternative data for equity research — supplementary public-record sources to extend filing-based cross-reference workflows
Sources
- Forensic accounting and prediction of financial reporting misconduct (review)
- Data analytics in financial statement fraud prevention and detection: systematic review (2010–2024)
- Brunswick Group 2026 Investor Survey
- Investor distraction and multi-dimensional financial narrative
Automation tactics that preserve evidence quality: drive all scraping from accession numbers (not company names, which can alias); use XBRL tag matching to pull the same financial concept across periods; build repeatable ETL pipelines that log the retrieval timestamp alongside the data. The systematic review recommends explainable AI models and robust data governance — in practice, that means every automated flag must carry a provenance record a human analyst can audit.
Pro Tip: When using an LLM to compare MD&A sections, always paste the raw text directly from the EDGAR filing rather than from a third-party aggregator. Aggregators occasionally truncate or reformat text in ways that alter the semantic signal you are trying to detect.