
Non-GAAP adjustment quality measures whether a company's exclusions from GAAP earnings are genuinely one-off, transitory items that improve forecasting, rather than recurring operating costs dressed up as anomalies. High-quality exclusions clarify cash flow; low-quality ones obscure it and raise regulatory exposure under Regulation G. The Securities and Exchange Commission (SEC) increasingly scrutinizes presentation choices that inflate adjusted earnings, and some forensic analytics platforms now quantify that gap systematically. The practical rule: judge exclusions by recurrence, prominence, and reconciliation clarity, not by management's label for them.
TL;DR:
- Exclusions appearing consistently over multiple quarters, especially above 20-30% of GAAP net income, generally indicate low exclusion quality and may mislead investors.
- Recurring adjustments, such as restructuring charges or stock compensation, often signal low-quality exclusions, whereas one-time, well-explained, and cash-based items tend to score higher.
- Regulatory scrutiny targets adjustments that lack transparency, are repeated over many periods, or are inappropriately prominent compared to GAAP figures.
- A structured, multi-factor scoring approach that considers recurrence, magnitude, and disclosure clarity, weighted by dollar amount, provides a reliable measure of exclusion quality.
- Continuous monitoring tools like Lacunaindex enable firms and analysts to identify and track narrative-to-delivery gaps across periods and sectors, reducing reliance on manual checks.
Table of Contents
- What "Non-GAAP Adjustment Quality" Actually Means
- A Checklist for Spotting High-Quality vs. Low-Quality Exclusions
- What Regulators and Auditors Look for in Non-GAAP Disclosures
- What the Research Shows About Exclusion Quality and Market Outcomes
- A Repeatable Process for Scoring Exclusion Quality
- How Lacuna Index Applies This Framework at Scale
- Why Comparability Across Periods Matters as Much as the Exclusion Itself
- How Analysts and Rating Systems Actually Score Exclusion Quality
- How Adjustment Quality Shapes Investor Decisions
- Communicating Non-GAAP Adjustments Without Inviting Scrutiny
- Lessons From Companies That Got Non-GAAP Disclosure Wrong
- Stewardship vs. Valuation: Where Practitioners Go Wrong
- Where Lacunaindex Fits Into Ongoing Exclusion Monitoring
- Where to Go Deeper on Non-GAAP Rules and Data
- Sources
- FAQ
What "Non-GAAP Adjustment Quality" Actually Means
Assessing exclusion quality requires three overlapping lenses. The first is economic nature: does the item recur across periods, or is it truly episodic? The second is accounting measurement: is the adjustment correcting a genuine timing distortion, or simply removing a normal operating expense? The third is valuation relevance: does excluding the item improve an analyst's ability to forecast future cash flow, or does it just inflate the number?
Certain categories appear constantly in reconciliations, and each carries a different quality profile:
- Amortization of intangibles — often high-quality when tied to acquisition accounting, since it is non-cash and rarely predictive of future spending.
- Restructuring charges — quality varies sharply; a single plant closure differs from restructuring booked in six consecutive quarters.
- Impairments — frequently legitimate one-time write-downs, but recurring impairments suggest chronic asset mismanagement.
- Stock-based compensation — a persistent low-quality exclusion, since it is a real, recurring cost of running the business.
- Tax adjustments, litigation reserves, FX, and gains/losses on divestitures — quality depends heavily on frequency and materiality relative to GAAP net income.
A Checklist for Spotting High-Quality vs. Low-Quality Exclusions
Reading a reconciliation table tells you less than testing it against a short set of observable criteria. Applying these tests consistently is what separates a rigorous review from a skim of the earnings release.
- Check serial correlation. An exclusion appearing in four or more consecutive quarters is behaving like an operating expense, not a one-off.
- Compare size to GAAP net income. Adjustments exceeding 20 to 30 percent of GAAP earnings deserve extra scrutiny regardless of label.
- Read the reconciliation narrative. High-quality disclosures explain why an item is non-recurring, not just what it is.
- Separate cash from non-cash items. Non-cash exclusions (certain amortization) are often easier to justify than cash exclusions labeled "one-time."
- Assess prominence. If the non-GAAP figure appears before GAAP figures in the earnings release, that placement itself is a quality signal, usually a negative one.
- Test management's rationale against the operating model. Does the exclusion align with how the business actually generates revenue, or does it look tailored to hit a number?
A high-quality example: a one-time facility closure charge booked once, fully explained, and never repeated. A low-quality example: "restructuring" charges appearing in nine of the last ten quarters with shifting justifications each time.
Pro Tip: Track exclusions in a running spreadsheet across at least eight quarters before forming a view. A single quarter's adjustment tells you almost nothing about whether the company is managing earnings.
What Regulators and Auditors Look for in Non-GAAP Disclosures
The SEC's guidance on non-GAAP measures sets the baseline every filer is expected to meet: measures must be clearly labeled, reconciled to the most comparable GAAP figure, and presented without misleading prominence. SEC guidance on non-GAAP financial measures specifically flags "individually tailored accounting principles," meaning custom adjustments that effectively create a bespoke accounting framework, as a primary enforcement trigger.
Comment letters tend to cluster around a few recurring issues:
- Non-GAAP figures given greater visual or textual prominence than GAAP results.
- Exclusion of normal, recurring cash operating expenses under a "non-recurring" label.
- Inconsistent adjustments from quarter to quarter without disclosed rationale.
- Reconciliations that omit a required line item or bury it in a footnote.
The SEC's own interpretive release and staff examples illustrate exactly the kind of wording that invites follow-up. Auditors and disclosure committees respond by testing whether management can articulate, in writing, a consistent economic reason for each exclusion, and by confirming that internal controls flag repeat adjustments before they reach the earnings release. Practitioner guidance from major accounting firms echoes this: clear labeling and functioning disclosure controls are treated as the minimum bar, not a competitive advantage.
What the Research Shows About Exclusion Quality and Market Outcomes
The strongest empirical case for taking exclusion quality seriously comes from a peer-reviewed rating system that scores non-GAAP exclusions on a 1 to 5 scale using serial correlation, survey validation, and regulator approval patterns. Firms scoring lower on this scale receive measurably more SEC comment letters and Regulation G citations, along with wider analyst forecast dispersion and slower price discovery after earnings announcements.
The pattern practitioners should internalize: low exclusion-quality scores don't just predict regulatory friction, they predict market confusion. Analysts covering low-quality adjusters disagree with each other more, and the stock takes longer to reflect the true earnings signal.
A parallel study using the same rating framework through a university research repository confirms the pattern across a broader sample, reinforcing that this is not an artifact of one dataset or one time period. Notably, the negative market effects are not uniform. Research on qualitative disclosure characteristics finds that firms offering transparent, narrative-rich reconciliations see smaller adverse price reactions even when their adjustments are individually large. Disclosure quality acts as a buffer against the market's suspicion of aggressive exclusions.
The practical inference: a large exclusion paired with a clear explanation is treated very differently by the market than the same exclusion buried in boilerplate language.
A Repeatable Process for Scoring Exclusion Quality
Turning the checklist above into a defensible, firm-year diagnostic takes four steps.
- Identify the target metric. Start with the most aggressive non-GAAP figure the company reports (typically adjusted EBITDA or non-GAAP net income), then extract every reconciling line item from the earnings release.
- Classify each exclusion. Score each item 1 (low quality) to 5 (high quality) across the three lenses: economic nature, accounting measurement, and valuation relevance. An item that is recurring, cash-based, and untied to any specific cash flow event scores low; a genuinely episodic, well-explained, non-cash item scores high.
- Weight by magnitude. Compute a weighted average score using each exclusion's dollar size as the weight. A $5 million rounding adjustment should not carry the same influence as a $200 million recurring add-back. Small, rare items can be noisy signals and deserve less weight than large, recurring add-backs that materially distort forecasts.
- Adjust for disclosure quality. Layer in a modifier for prominence, reconciliation clarity, and narrative completeness. A firm with a mediocre raw exclusion score but excellent disclosure practices should rank differently than one with the same raw score and boilerplate language.
Pro Tip: Treat the final score as a monitoring trigger, not a verdict. A weighted score below your threshold should route to a disclosure committee review or an adjustment to your own forecast model, not an automatic downgrade.
How Lacuna Index Applies This Framework at Scale
Certain forensic analytics platforms build reports by mining public disclosures such as earnings calls, SEC filings, proxy statements, and press releases, scoring the distance between what a company claims and what the record shows it delivered. This audit-traceable process maps directly onto exclusion-quality work, with every score tying back to a specific, citable public document, not a proprietary black box.
For teams running exclusion-quality reviews across a coverage list, Lacunaindex's sector benchmarks and per-company execution scores offer a way to flag firms whose narrative-to-delivery gap is widening before the next earnings cycle. The practical workflow most teams settle on: run the manual checklist on flagged names, then use Lacunaindex output as an ongoing monitoring layer between quarterly reviews.
Why Comparability Across Periods Matters as Much as the Exclusion Itself
A single quarter's adjustment rarely tells the full story. Consistency, whether a company excludes the same category of item the same way every quarter, is often a better quality signal than the size of any one adjustment. When a company changes its definition of "adjusted operating income" between fiscal years, drops an exclusion category quietly, or starts excluding a cost it previously treated as recurring, that shift deserves more scrutiny than the adjustment itself.
Comparability breaks down in a few recognizable ways. A company might rename an adjustment category to avoid drawing attention to its persistence, a practice regulators increasingly treat as a form of the "individually tailored accounting principles" problem the SEC has flagged. Alternatively, a business might expand the scope of what counts as a restructuring charge right as the underlying charges become more frequent, effectively hiding a trend inside a category that once looked episodic.
The fix for reviewers is procedural: hold each firm's non-GAAP definitions constant across the trailing eight to twelve quarters before drawing conclusions about a single period's number. Restate prior periods using the current definition when a company changes its methodology, and note the change explicitly in your own analysis. If a company cannot explain why its adjustment categories shifted, that silence is itself informative. Comparability failures rarely show up as a single dramatic red flag. They accumulate quietly, one redefinition at a time, until the adjusted earnings trend and the GAAP earnings trend tell two very different stories.
How Analysts and Rating Systems Actually Score Exclusion Quality
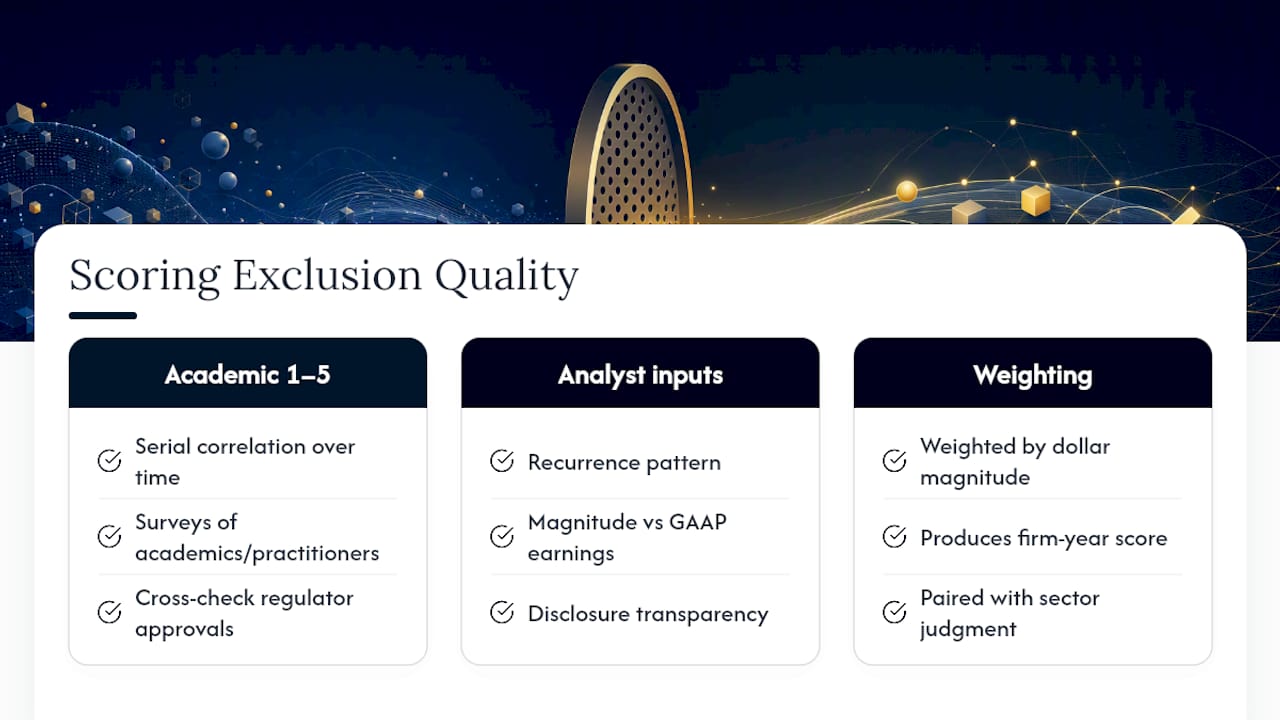
Academic and practitioner approaches to scoring exclusion quality converge on a few measurable proxies rather than relying on subjective impressions. The peer-reviewed 1 to 5 rating system validated in the Review of Accounting Studies combines several independent checks: statistical serial correlation of each exclusion category over time, surveys of academics and practitioners on what "should" count as non-recurring in a given industry, and cross-referencing against actual regulator approvals and objections.
That multi-method approach matters because no single test is reliable alone. Serial correlation catches items that repeat mechanically but misses exclusions that recur under shifting labels. Survey-based judgment captures industry context, since a $50 million legal reserve means something different for a pharmaceutical company mid-litigation than for a software firm, but is harder to apply consistently across a large coverage universe. Regulator-approval data adds a real-world check: if the SEC has previously objected to similar exclusions industry-wide, that is a strong signal worth weighting heavily.
In practice, most working analysts compress this into three inputs: recurrence pattern, magnitude relative to GAAP earnings, and disclosure transparency. A firm-year score assembled from those three inputs, weighted by dollar magnitude, produces a defensible rating without requiring a full academic dataset. The exclusion-quality concept is inherently contextual. The same restructuring label can be high quality for a company divesting a single business line and low quality for a company using the same term every year to smooth earnings. Mechanical scoring should always be paired with sector-specific judgment.
How Adjustment Quality Shapes Investor Decisions
Investors who take non-GAAP figures at face value without checking exclusion quality routinely misprice forward earnings. When a company's adjusted EBITDA strips out stock-based compensation that has run at 8 to 10 percent of revenue for three straight years, an investor modeling forward margins off that adjusted figure is building a forecast on a number that omits a real, recurring cost of doing business.
The consequence shows up most clearly in valuation multiples. A stock trading on a multiple of adjusted earnings that excludes recurring costs looks cheaper than it is; once the market recalibrates toward GAAP-consistent earnings, often triggered by an SEC comment letter, a management change, or a competitor's more conservative reporting, the multiple compresses fast. That is a structural reason low exclusion-quality scores correlate with wider analyst forecast dispersion: different analysts are effectively modeling different companies depending on how much of management's adjusted narrative they accept.
Institutional investors increasingly build exclusion-quality checks into their own screening process rather than relying on the headline adjusted number a company promotes in its earnings release. The practical takeaway for anyone underwriting a position: treat the GAAP to non-GAAP bridge as a primary source document, not a footnote. The size and pattern of that bridge often say more about earnings durability than the adjusted number itself.
Communicating Non-GAAP Adjustments Without Inviting Scrutiny
Companies that manage non-GAAP disclosure well tend to follow a consistent set of habits, and the absence of any one of them is usually visible to a careful reader. GAAP figures appear first and with equal or greater prominence than adjusted figures, exactly as the SEC's guidance requires. Every reconciling line item gets a plain-language explanation of why it was excluded, not just a label.
Consistency across periods is treated as a discipline, not an afterthought: a company that plans to exclude a cost category should be prepared to exclude it the same way for as long as the category persists, and to say so if the definition ever changes. Disclosure committees that function well typically require sign-off from both finance and legal before an adjustment category is introduced for the first time, precisely because a new exclusion type is the moment most likely to draw regulatory attention later.
The strongest practice observed across well-regarded filers is pairing every adjusted metric with a short qualitative note tying the exclusion to a specific, identifiable event, an acquisition date, a named facility closure, a specific legal matter, rather than a generic category label. That specificity is exactly what the research on qualitative disclosure characteristics associates with smaller adverse market reactions, even for sizable adjustments. Vague labels invite the assumption that the company is hiding something; specific ones rarely do.
Lessons From Companies That Got Non-GAAP Disclosure Wrong
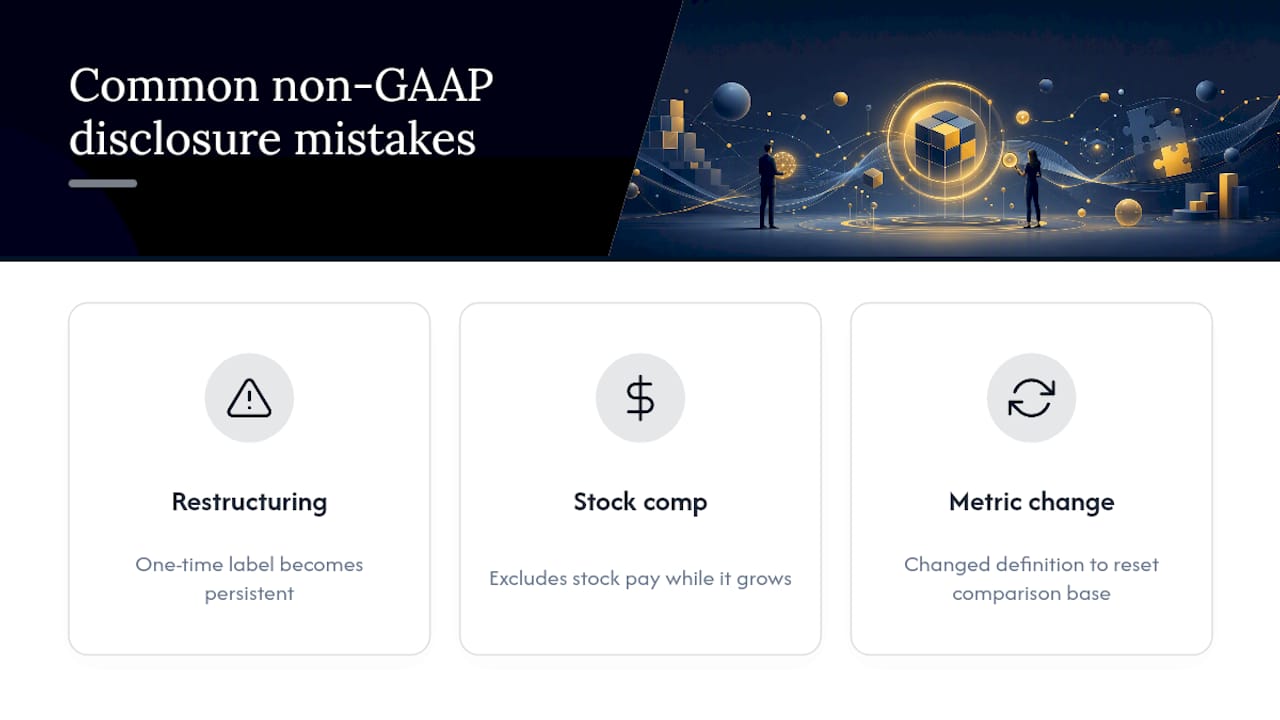
The pattern behind most non-GAAP controversies is remarkably consistent: a company introduces an adjustment category during a rough quarter, the category persists well past the point where it could plausibly be called one-time, and eventually either the SEC or the market notices the mismatch. Restructuring charges are the most common vehicle for this pattern, since the label carries an implicit promise of impermanence that many companies quietly abandon in practice.
A related pattern involves companies that adjust EBITDA to exclude stock-based compensation entirely while that expense grows as a share of revenue year over year. Because the adjustment is standard across an entire industry, particularly in software and biotechnology, it rarely draws individual comment letters, but it is precisely the kind of exclusion that academic rating systems consistently score as low quality, since the expense is cash-relevant to shareholders through dilution even when it is non-cash to the company.
A third recurring controversy type involves companies that change the definition of a non-GAAP metric between reporting periods without clearly flagging the change, effectively resetting the comparison base in a way that makes deteriorating performance look flat or improving. This is the exact behavior the SEC's guidance on individually tailored accounting principles targets, and it is also the behavior that detecting selective disclosure patterns is designed to catch before it compounds across several reporting cycles. None of these patterns require malicious intent to become a problem. They tend to start as a reasonable adjustment in a difficult quarter and drift into a structural feature of how the company reports earnings.
Stewardship vs. Valuation: Where Practitioners Go Wrong
Two distinct questions get conflated constantly in exclusion-quality reviews. Stewardship asks whether management is representing performance honestly. Valuation asks whether an exclusion improves your ability to forecast cash flow. An item can fail one test and pass the other.
Transparency is often underweighted as a mitigant. A company that excludes a large item but explains it clearly, ties it to a specific cash flow event, and repeats the same treatment consistently draws far less justified suspicion than a smaller, vaguer adjustment. The research on qualitative disclosure characteristics backs this directly.
The bigger mistake practitioners make is applying a rating scale mechanically across industries without adjusting for context, since the same adjustment type carries different implications for a software company than a manufacturer.
— Glen
Where Lacunaindex Fits Into Ongoing Exclusion Monitoring
Lacunaindex's Per-company analysis gives compliance teams and analysts a way to move exclusion-quality review from a quarterly scramble to continuous monitoring, without needing insider access or proprietary data feeds. Every score traces back to a specific public filing, earnings call transcript, or proxy statement, which is exactly the audit trail an internal disclosure committee or a skeptical analyst needs to defend a rating.
Two subscription products cover the range of most workflows. Sector Sweep benchmarks exclusion patterns and narrative-to-delivery gaps across an entire industry, useful for spotting when one filer's adjustment behavior has drifted from its peer group. Cohort Pulse tracks a defined watchlist of companies over time, flagging when a firm's exclusion pattern shifts quarter to quarter. Both are detailed on the pricing page. Teams typically run Lacunaindex output alongside the manual checklist covered above, using it as the ongoing layer that catches drift between the deep-dive reviews an analyst has time to do by hand. If your coverage list is large enough that manual exclusion tracking has become the bottleneck, start with a sector benchmark to see where the widest narrative-to-delivery gaps already sit.
Where to Go Deeper on Non-GAAP Rules and Data
For primary rules, consult the SEC's non-GAAP guidance. For the validated rating methodology, see the Review of Accounting Studies paper. For prevalence data, see Calcbench's annual non-GAAP analysis.
Sources
- A rating system to evaluate non-GAAP exclusion quality (Review of Accounting Studies)
- A rating system to evaluate non-GAAP exclusion quality (SMU research repository)
- SEC — Non-GAAP financial measures (Division of Corporation Finance guidance)
FAQ
What Are Non-GAAP Adjustments?
Non-GAAP adjustments are line items companies add back to or exclude from GAAP earnings, such as restructuring charges or stock-based compensation, to present an alternative metric like adjusted EBITDA that management argues better reflects core operations.
What Does Non-GAAP Mean in Accounting?
Non-GAAP means a financial figure calculated outside Generally Accepted Accounting Principles rules, typically by excluding specific items management deems non-recurring; the SEC requires these figures to be reconciled to their nearest GAAP equivalent under Regulation G.
Is GAAP or Non-GAAP More Accurate?
GAAP is the more reliable and standardized measure because it follows consistent, audited rules across all filers. Non-GAAP figures can offer useful operating insight, but their accuracy depends entirely on the quality of the exclusions behind them, which is exactly what exclusion-quality scoring is designed to test.
What Happens if a Company Does Not Follow GAAP?
Public companies are required to report GAAP results regardless of what non-GAAP figures they also present; failing to reconcile a non-GAAP measure to GAAP, or presenting it with misleading prominence, can trigger an SEC comment letter or enforcement action under Regulation G.
How Can I Check a Company's Exclusion Quality Without Building My Own Model?
You can apply the recurrence, magnitude, and disclosure checklist manually, or use a platform like Lacuna Index, which scores narrative-to-delivery gaps from public filings and publishes sector benchmarks for comparison.