
Measuring the board promise–delivery gap is possible using only public records: capture the explicit commitment text and timestamp from a filing, press release, or investor presentation; select the appropriate Delivery Performance (DP) variant from the DR–DP taxonomy; collect verified delivery outcomes from public evidence; and compute either DP_Volume_On_Time or promise variance (actual delivery timestamp minus promised timestamp). For broad operational programs, DP_Volume_On_Time is the recommended default. For time-definite singular commitments, promise variance distribution is the primary reliability measure.
- Required components: documented promise (source URL + timestamp), defined DP variant, public delivery evidence, calculation rule, and logged exclusions.
- Default rule: use Volume/On-time DP for high-volume programs; use promise variance for bespoke or time-definite commitments.
Key Takeaways
A reproducible, public-record-only measurement of the board promise–delivery gap requires a documented promise, a defined DP variant, verified delivery evidence, and a logged exclusion and sensitivity record before any score is published.
| Point | Details |
|---|---|
| Default DP variant | Use DP_Volume_On_Time for programs; use promise variance distribution for singular commitments. |
| Bain perception gap | 80% of management teams vs 8% of customers confirms independent verification is necessary. |
| Aggregation window | Rolling monthly or rolling quarter prevents one-off disruptions from distorting trend scores. |
| Governance cadence | Require quarterly DP reporting at board level with a mandatory variance explanation for drops exceeding five percentage points. |
| Lacunaindex application | Lacunaindex produces audit-traceable execution scores and sector benchmarks from public records only, ready for screening and stewardship engagement. |
Table of Contents
- Why does the promise–delivery gap matter to institutional investors?
- Core definitions and the metrics every measurement must include
- Choosing a measurement method: the DR–DP matrix
- What public records can you mine to validate delivery evidence?
- Common measurement traps and how to correct them
- Governance levers that close the gap
- How should institutional investors act on delivery-gap scores?
- Audit-ready methodology checklist
- Worked example: promise to DP calculation
- Why a public-record baseline is the right starting point
- Lacunaindex forensic reports for delivery-gap analysis
- Sources
Why does the promise–delivery gap matter to institutional investors?
Bain's survey of 362 firms found that 80% of management teams believed they delivered a superior experience, while customers confirmed that only around 8% actually did. That perception gap is not merely a customer-service problem. When a board's public commitments systematically outpace verified delivery, the resulting disclosure opacity creates mispricing risk that governance advocates and institutional investors cannot afford to ignore.
Undisclosed delivery failure distorts valuation in two ways. First, markets price the narrative rather than the execution, inflating multiples for companies whose delivery scores would not support them. Second, repeated promise breaches erode creditor and counterparty trust in ways that surface only after a credit event or regulatory action. A reproducible delivery-gap score converts that latent risk into a testable, audit-traceable signal. Investors can then use it for screening, stewardship engagement, and proxy voting decisions grounded in evidence rather than management assertion.
Organizations also commonly confuse internal efficiency metrics with customer-facing delivery promises. Measuring from the customer clock (order confirmation or public promise timestamp) rather than from warehouse throughput or carrier SLAs reveals gaps that internal KPIs routinely conceal.
Core definitions and the metrics every measurement must include
Promise refers to any explicit, public commitment: a 10-K or 8-K disclosure, an earnings call statement, a press release, an investor presentation slide, or a customer-facing checkout promise. Scope rules differ for singular promises (one bespoke commitment) and program promises (a recurring operational standard applied across many transactions).
Delivery Performance (DP) measures the proportion of promises fulfilled within the defined tolerance window. DP formulas take three primary forms:
- DP_Volume_On_Time: fulfilled volume ÷ total promised volume, within tolerance.
- DP_Singular_On_Time: binary pass/fail per individual promise, aggregated as a rate.
- DP_Volume_Delivery: fulfilled volume ÷ total promised volume, measured at actual delivery date regardless of timing.
On-time-in-full (OTIF) combines timing and completeness: a delivery counts only when the full quantity arrives within the promised window. OTIF is the standard board-level KPI for operational programs.
Promise variance is defined as actual delivery timestamp minus promised delivery timestamp. CXTMS recommends reporting its distribution (percentage early, on-time, one-day late, and 90th percentile) rather than a single average, because averages mask tail risk.
Every audit-traceable measurement table must include these columns:
| Column | Description |
|---|---|
| Promise ID | Unique identifier for each commitment |
| Source | Filing type, URL, and publication timestamp |
| Promised date/window | Explicit date or range stated in the source |
| Observed outcome | Verified delivery date or fulfillment status |
| DP variant used | Volume/On-time, Singular/On-time, or Volume/Delivery |
| Exclusions logged | NULL-demand SKUs, re-promises, force majeure |
Choosing a measurement method: the DR–DP matrix
The DR–DP matrix maps two axes: promise granularity (Volume vs Singular) and timing rule (On-time vs Delivery). Selecting the wrong cell produces a score that is technically correct but analytically misleading.
Decision criteria:
- High promise volume, standardized terms, timing-sensitive: use DP_Volume_On_Time.
- Bespoke or high-value singular commitments: use DP_Singular_On_Time.
- Timing less material than completeness (e.g., bulk commodity delivery): use DP_Volume_Delivery.
- Aggregation window: weekly for operational monitoring; rolling monthly or rolling quarter for investor-grade trend analysis. Short windows amplify one-off disruptions; rolling aggregation smooths them without hiding structural deterioration.
Tolerance windows must be defined before data collection, not after. Post-hoc tolerance adjustment is one of the most common sources of score inflation.
What public records can you mine to validate delivery evidence?
Public-record evidence falls into five categories, each with distinct extraction and validation requirements:
- SEC filings (10-K, 8-K, proxy): extract explicit promise text, promised dates, and management commentary on delivery status. Cross-reference year-over-year language shifts to detect re-promises.
- Earnings call transcripts: capture management assertions about delivery timelines and analyst follow-up questions. Timestamp each claim to the quarter.
- Press releases and investor decks: often contain the most specific promise language. Archive with a dated snapshot (Wayback Machine or equivalent) to prevent retroactive editing.
- Regulatory and third-party reports: carrier performance data, customs filings, and industry association reports can corroborate or contradict internal claims.
- Customer-facing promises: checkout pages, product landing pages, and public SLA disclosures. These establish the customer-clock start point.
Forensic promise-tracking methods recommend timestamped archival snapshots as the primary version-control mechanism. When a company rewords a promise between filings, log both versions with their respective timestamps and treat the restatement as a separate promise event.
Pro Tip: When a company issues a re-promise (revising a prior commitment), do not silently replace the original. Log the original promise, its miss, and the revised commitment as three separate records. This preserves the full accountability trail and prevents score inflation from promise substitution.
A systematic review confirms that transparent evaluation processes, rather than superficial scoring, are what build stakeholder trust. Behavioral analysis of why a gap exists matters as much as the gap's magnitude.
Common measurement traps and how to correct them
Typical pitfalls:
- NULL-SKU inclusion: counting zero-demand items inflates the denominator and artificially depresses DP. Exclude items with no confirmed demand in the measurement period.
- Wrong clock start: beginning the measurement at warehouse dispatch rather than public promise timestamp understates the gap. Always start at the customer-facing commitment.
- Mixing carrier SLAs with checkout promises: carrier SLAs are internal contracts; checkout promises are public commitments. Measuring against the former masks failures visible to the latter.
- Short aggregation windows: a single week of disruption can move a score by 20+ percentage points. Rolling monthly or quarterly windows are required for trend reliability.
- Tolerance-window drift: widening the tolerance window between periods without disclosure is a form of score manipulation. Fix the window at the start of each measurement cycle.
Corrective rules to apply before publishing:
- Confirm all NULL-demand SKUs are excluded and documented.
- Verify the clock start matches the public promise timestamp, not an internal process date.
- Confirm the tolerance window is unchanged from the prior period.
- Run a sensitivity test: recalculate DP with a tolerance window one day tighter and one day wider. If the score changes by more than five percentage points, disclose the sensitivity range.
- Confirm the aggregation window is rolling, not calendar-period, unless the promise itself specifies a calendar period.
Governance levers that close the gap
Bain's research identifies cross-functional accountability and customer inner circles as the primary organizational mechanisms for closing delivery gaps. Inner circles surface real customer experience rather than relying on internal metrics that management teams tend to over-report.
Institutional levers, in priority order:
- Align KPIs to public promises: require management to demonstrate that board-level KPIs map directly to the specific commitments made in filings and investor presentations.
- Cross-functional delivery ownership: assign a named executive owner to each public promise, with a documented resource plan.
- Audit-traceable KPIs in board packs: require that board reporting include the DP variant used, the aggregation window, and the exclusion log, not just the headline score.
- Customer feedback loops: embed structured customer-experience data (Net Promoter Score, complaint rates, WISMO contact rate) alongside DP scores to detect divergence between internal and external views.
Best practice treats public narrative claims as testable hypotheses, requiring management to show audit-traceable KPIs that demonstrate resource alignment with each promise.
Pro Tip: Demand a governance cadence of at least quarterly DP reporting at board level, with a mandatory variance explanation for any period where DP falls more than five percentage points below the prior rolling average. Explanations without a corrective action plan should be treated as a governance red flag.
How should institutional investors act on delivery-gap scores?
Scores become useful only when tied to specific investor actions. A structured approach:
- Screening: filter for companies whose rolling-quarter DP falls below sector median. Flag for deeper forensic review before adding to or maintaining a position.
- Engagement trigger: a DP score more than ten percentage points below the company's own prior-year average warrants a stewardship engagement letter requesting the DP variant used, the tolerance window, and the exclusion log.
- Escalation: persistent gap zone status (three consecutive quarters below sector median) supports escalation to a board challenge or a vote against the relevant committee chair.
- Benchmarking: compare scores against sector DP baselines rather than the company's own prior periods alone. Sector context distinguishes structural underperformance from industry-wide disruption.
- Valuation integration: feed promise variance distribution (specifically the 90th percentile) into downside scenario assumptions. A company whose 90th-percentile promise variance exceeds 48 hours in a sector where competitors average 24 hours carries measurable execution risk.
Accountability scoring frameworks show how scores feed governance decisions when they are reproducible and sector-benchmarked. Pairing quantitative DP measures with qualitative perception data, as public-service evaluation literature recommends, strengthens the analytical basis for engagement.
Audit-ready methodology checklist
Before publishing any delivery-gap score, complete each step in sequence:
- Capture the promise text verbatim, with source URL and publication timestamp.
- Select the DP variant (Volume/On-time, Singular/On-time, or Volume/Delivery) and document the selection rationale.
- Define the tolerance window and fix it for the measurement period.
- Collect outcome evidence from public records only; log each source URL and retrieval date.
- Compute DP and promise variance; record both the headline figure and the distribution.
- Log all exclusions (NULL-demand items, re-promises, force majeure events) with explanations.
- Run sensitivity tests on the tolerance window (±1 day) and aggregation window (±1 week).
- Disclose: aggregation window, sample size, excluded items, re-promise count, and sensitivity range.
- Conduct peer validation: a second analyst independently replicates the calculation from the logged sources.
- Set a review cadence: quarterly for trend monitoring; ad hoc within 30 days of a material re-promise.
Required disclosures for any published score:
- DP variant and tolerance window used.
- Aggregation window (rolling vs calendar period).
- Sample size (number of promises evaluated).
- Exclusion count and categories.
- Sensitivity range from step 7.
Worked example: promise to DP calculation
Promise text (genericized): "We expect to complete customer migrations by end of Q2 2025" (source: 8-K filed April 15, 2025).
DP variant selected: DP_Singular_On_Time (bespoke, time-definite commitment).
Tolerance window: 0 days (explicit calendar deadline).
Calculation:
- Promises evaluated: 1 (program-level singular commitment).
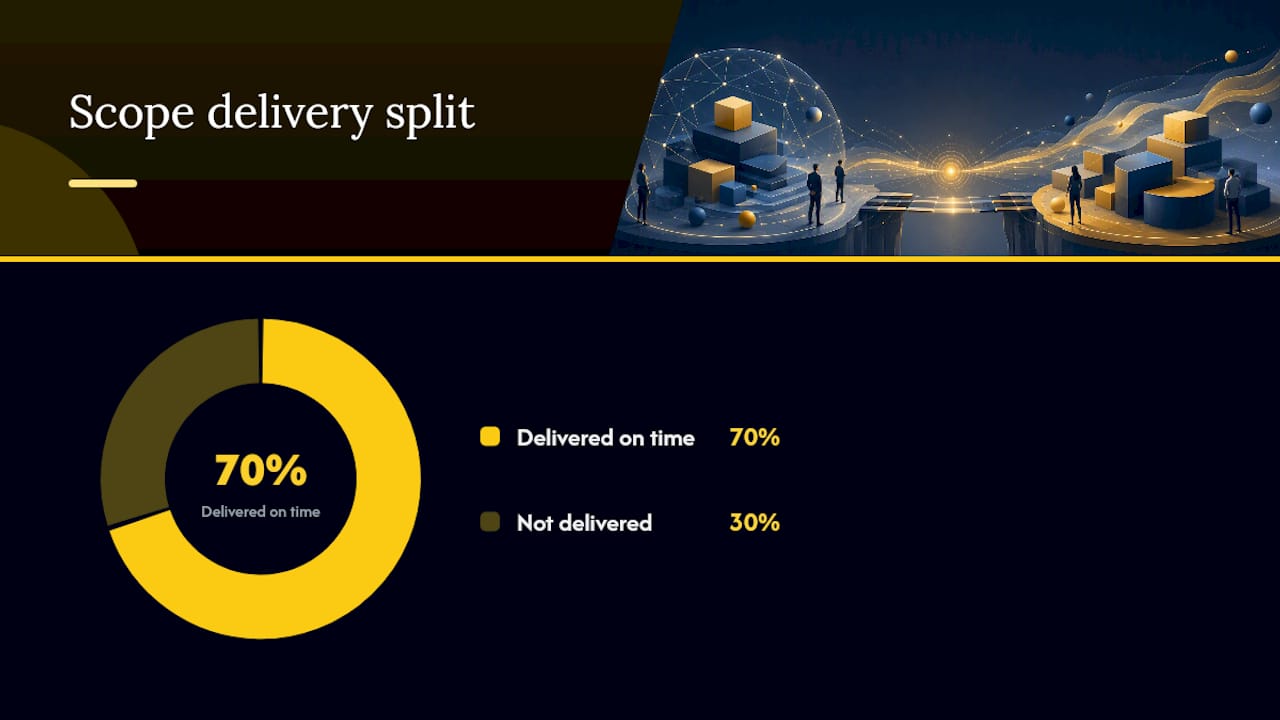
- Outcome: partially delivered (70% of scope by deadline).
- DP_Singular_On_Time: 0 (the singular commitment was not fully met within tolerance).
- Promise variance: delivery of remaining 30% not confirmed until Q3 2025, placing variance at approximately 90+ days for the incomplete portion.
| Metric | Value | Interpretation |
|---|---|---|
| DP_Singular_On_Time | 0% | Full commitment missed within tolerance |
| Partial completion rate | 70% | Partial credit; not counted in binary DP |
| Promise variance (tail) | 90+ days | Material execution lag for remaining scope |
| Re-promise issued? | Yes (Q3 completion) | Log as separate promise event |
Investor interpretation:
- A binary miss on a singular commitment is a governance signal, not a rounding error.
- The 70% partial rate, while operationally meaningful, does not satisfy the public commitment as stated.
- The re-promise (Q3 completion) must be tracked as a new commitment with its own DP calculation.
- Sensitivity: widening tolerance to 30 days does not change the DP_Singular_On_Time score, confirming the miss is structural rather than marginal.
Why a public-record baseline is the right starting point
The forensic case for public-record-only measurement rests on a straightforward principle: any metric derived from non-public data cannot be independently verified, replicated, or challenged. When an investor or governance advocate constructs a delivery-gap score from earnings call transcripts, SEC filings, and archived press releases, the methodology is auditable by any party with access to the same public record. That auditability is what converts a score from an opinion into evidence.
The five-state classification ladder, as applied in Lacunaindex's forensic methodology, maps companies from "earned" (consistent delivery above narrative) through "borrowed" (narrative ahead of delivery) to "undervalued" (delivery ahead of narrative). Each state is a testable hypothesis, not a judgment. The public-record baseline is what makes the hypothesis testable. Without it, governance engagement devolves into a negotiation over whose internal data is more credible.
Lacunaindex forensic reports for delivery-gap analysis

Lacunaindex applies the DR–DP measurement framework described here to public companies across sectors, producing audit-traceable execution scores and promise variance distributions derived entirely from public records. Subscribers access per-company forensic reports that map each public commitment to its verified delivery outcome, classify the company on the five-state accountability ladder, and benchmark the result against sector DP baselines. Free sector benchmarks are available without a subscription, giving governance teams a reference point before commissioning a full forensic report. For institutional investors who need reproducible, engagement-ready evidence, a Lacunaindex subscription delivers the scored, sourced, and peer-validated output the methodology checklist above requires. Visit Lacunaindex to access sector benchmarks or request a forensic report for a company under review.
Sources
- Systematic review on evaluation models and transparency
- Delivery reliability needs its own promise metric—Not a faster average | CXTMS
- Approaches for evaluating public services from the user's perspective