
The CEO promise fulfillment rate is the percentage of publicly documented executive commitments that reach verified completion within a defined observation window. The fastest audit-traceable calculation is:
Raw Fulfillment Rate = (Verified Fulfilled Promises) ÷ (Total Tracked Promises) × 100
Scope that formula to promises extracted from earnings-call transcripts, 10-K and 8-K filings, press releases, investor presentations, and proxy statements. The recommended pipeline runs five steps: detect commitments from public records, code each for specificity and timeline, set fulfillment criteria, verify outcomes with documentary evidence, and compute both raw and specificity-adjusted rates. Each step produces a timestamped, source-linked record that supports independent audit.
Required public records to begin:
- Earnings-call transcripts (primary promise source, highest density)
- 10-K and 8-K filings (formal commitments and material updates)
- Press releases and investor presentations (product, M&A, and strategic pledges)
- Proxy statements (compensation-linked targets and governance commitments)
Key takeaways
Measuring CEO promise fulfillment rate with audit-traceable methodology requires a verbatim promise ledger, specificity-adjusted scoring, and a continuous governance cadence that links delivery metrics directly to compensation and board review.
| Point | Details |
|---|---|
| Core formula | Raw Fulfillment Rate = Verified Fulfilled Promises ÷ Total Tracked Promises × 100. |
| Specificity adjustment is critical | SAFR weights promises by specificity score; a gap between RFR and SAFR signals narrative-only delivery. |
| Horizon varies by topic | Mean promise horizon is ~11.5 months overall; ESG and DEI commitments often run 28–34 months. |
| Broken promises carry succession risk | Each additional broken promise increases involuntary CEO dismissal odds by approximately 22%. |
| Lacunaindex operationalizes the pipeline | Subscribers receive a verbatim promise ledger, execution score, SAFR, and archetype classification from public records. |
Table of Contents
- What counts as a promise, fulfillment, and the observation window
- Primary public data sources and how to extract evidence
- The five-step measurement pipeline
- Core metrics and how to calculate them
- A reproducible five-state rubric and archetype classification
- How boards and investors should interpret and act on fulfillment metrics
- Known measurement challenges and how to reduce bias
- Operationalizing the measurement: a governance checklist
- Why forensic measurement changes the governance calculus
- Lacunaindex turns this methodology into a subscription workflow
- Sources
What counts as a promise, fulfillment, and the observation window
A promise, for measurement purposes, is any public commitment by a named executive that implies a deliverable, a measurable outcome, or an explicit or implied timeline. Generic guidance language ("we remain focused on growth"), rehashed strategy boilerplate, and aspirational mission statements do not qualify. The commitment must be attributable to a specific speaker and must carry enough content that an independent analyst could later assess whether it was met.
Fulfillment requires documentary evidence that the stated deliverable was completed, or that delivery occurred within the agreed timeline or a formally revised timeline accompanied by an acceptable justification. A press release announcing product launch, a subsequent 10-K confirming a financial target, or a regulatory filing confirming a structural change each constitute valid fulfillment evidence. Partial delivery does not count as fulfillment unless the original promise explicitly allowed phased completion.
The observation window anchors to the promise date and extends to the stated or implied horizon. Research analyzing more than 69,000 earnings-call transcripts found a mean promise horizon of approximately 11.5 months, though topic-specific horizons vary considerably, with sustainability, DEI, and energy-transition commitments generally running longer than average. Analysts should apply topic-adjusted horizon baselines rather than a single universal window.
Decision rules for edge cases:
- Retracted promises: code as "Not Delivered" unless retraction occurred within 30 days of issuance and was accompanied by a material-event disclosure.
- Scope changes: flag as "Reinterpreted/Redefined" and preserve the original coding; do not overwrite.
- Joint or attributed promises: assign ownership to the CEO when the CEO is the named speaker; attribute to the company when no individual is named and the CEO is the signatory.
Pro Tip: Build a verbatim ledger from the outset. Paraphrased promise records introduce definitional drift; verbatim capture with source URL and timestamp is the only defensible standard for audit-traceable scoring.
Primary public data sources and how to extract evidence
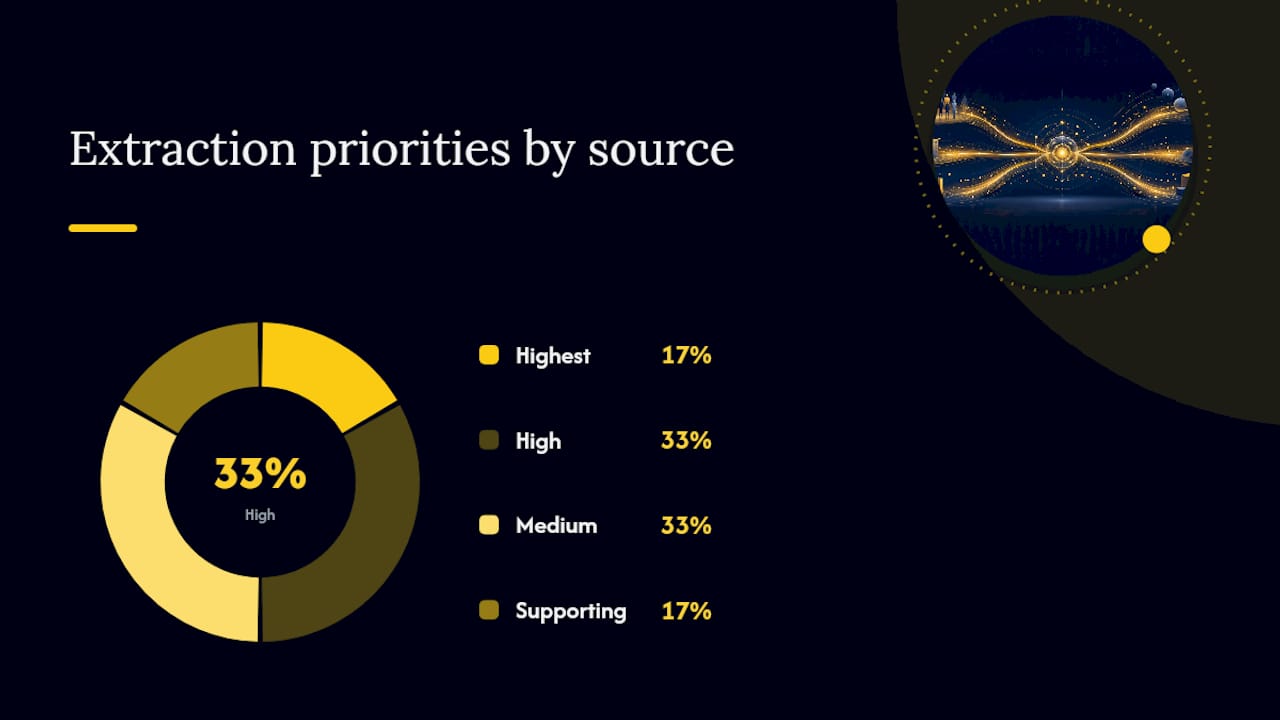
The table below maps each source type to its primary evidence value and extraction priority.
| Source | Primary Evidence | Priority |
|---|---|---|
| Earnings-call transcripts | Promise detection, speaker attribution, timeline language | Highest |
| 10-K / 8-K filings | Formal commitments, material updates, fulfillment confirmation | High |
| Press releases | Product, M&A, and operational pledges | High |
| Investor presentations | Strategic targets, multi-year commitments | Medium |
| Proxy statements | Compensation-linked targets, governance pledges | Medium |
| Regulatory filings (SEC EDGAR) | Corroborating evidence for fulfillment verification | Supporting |
Extraction discipline matters as much as source selection. For each captured promise, record: verbatim quoted language (never paraphrase), speaker name and title, source document type, filing or publication date, and a stable source URL or SEC accession number. When corroborating fulfillment, capture the corroborating document with the same fields and link it explicitly to the original promise record.
Computational analysis using large language models found CEOs make just over one promise per earnings-call transcript on average, though a substantial share of calls contain no promises and many contain only one. That density distribution means analysts should not assume every transcript yields a codeable commitment; systematic coverage of all transcripts in a period is necessary to avoid selection bias.
Data integrity requirements for audit-traceable scoring:
- Verbatim capture with no editorial modification
- Stable source URL or SEC accession number for every record
- Timestamped versioning of the coding dataset (date of extraction, date of coding, date of outcome verification)
- Separate fields for original promise text and fulfillment evidence text
The five-step measurement pipeline
-
Detect promises. Apply NLP-assisted screening to earnings-call transcripts and press releases to flag candidate commitment language (modal verbs, forward-looking constructions, explicit deliverable phrases). Follow with human verification to confirm each candidate meets the operational definition. Log every accepted promise with verbatim text, speaker, source, and date.
-
Code promise attributes. For each logged promise, assign: a specificity score (1 = vague aspiration, 2 = directional with metric, 3 = precise with numeric target and timeline), a stated or implied horizon date, a topic category (financial, operational, strategic, ESG), and an ownership tag (CEO-named or company-attributed).
-
Set fulfillment rules and horizon adjustments. Define grace periods (typically 30–60 days beyond the stated horizon) and establish an external-event flag protocol for macro shocks, regulatory changes, or force-majeure conditions that materially altered delivery feasibility. Document all rule decisions in a coding appendix before outcome verification begins.
-
Verify outcomes with documentary evidence. For each promise at or past its horizon, search corroborating public records. Attach the fulfillment evidence record or record the absence of evidence. DDI's review of evaluation methods confirms that reproducible scoring systems require both a rubric and an integrated summary with ratings and narrative; apply the same standard here.
-
Compute and version the dataset. Calculate raw and adjusted rates (formulas in the next section). Save a dated snapshot of the full coding dataset at each computation cycle. Version control preserves the audit trail if coding rules are refined in later periods.
Pro Tip: Inter-rater reliability checks are not optional. Have two analysts independently code a 10% random sample of promises each quarter, then calculate Cohen's kappa. A kappa below 0.70 signals definitional ambiguity that will corrupt comparability across periods.
Core metrics and how to calculate them
Raw Fulfillment Rate (RFR): (Verified Fulfilled Promises ÷ Total Tracked Promises) × 100. Interpret as the baseline delivery percentage before adjusting for promise quality.
Specificity-Adjusted Fulfillment Rate (SAFR): Weight each promise by its specificity score before computing the rate. Formula: Σ(Specificity Score × Fulfillment Binary) ÷ Σ(Specificity Score) × 100. A CEO who fulfills only vague promises while missing precise commitments will show a lower SAFR than RFR, which is the more informative signal for investors.
Median Time-to-Fulfillment (MTF): The median elapsed days from promise date to verified fulfillment date, calculated across all fulfilled promises in the period. Use survival analysis (Kaplan-Meier) to handle censored promises (those still open at the analysis date) without biasing the distribution downward.
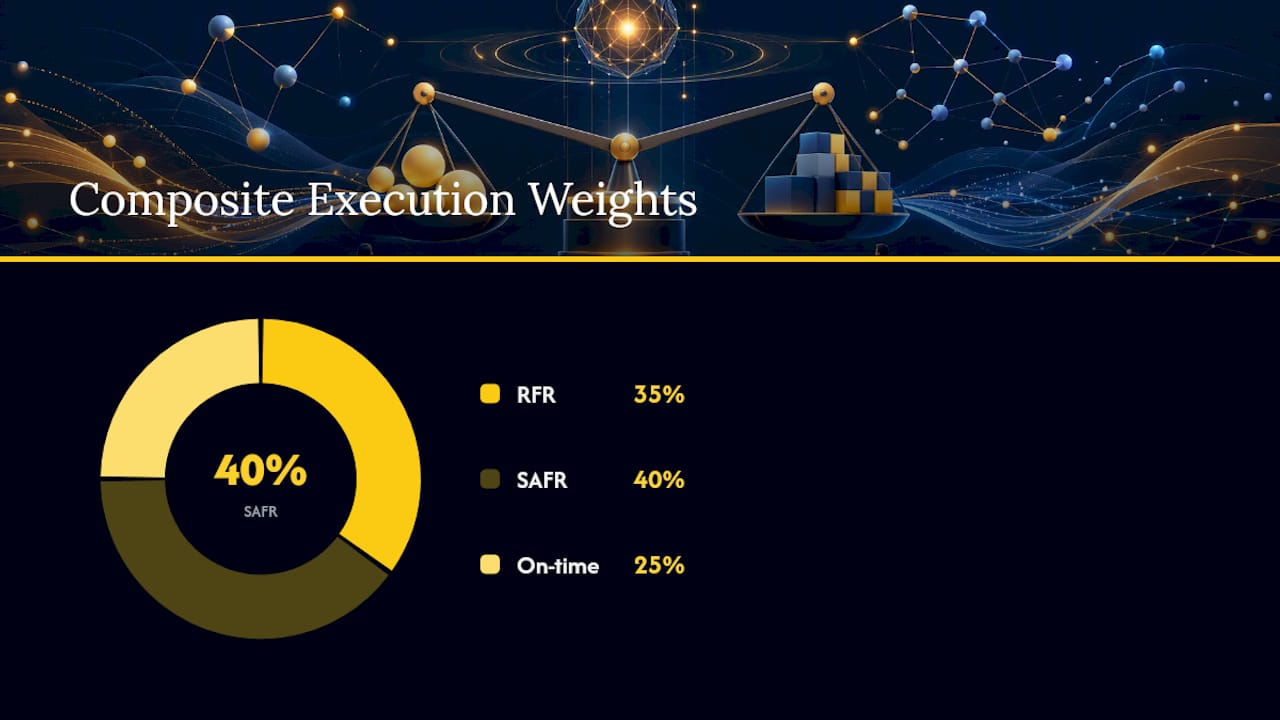
Composite Execution Score: Combine RFR, SAFR, and an on-time delivery ratio (fulfilled promises delivered within the stated horizon ÷ total fulfilled promises) into a weighted composite. A straightforward weighting: RFR × 0.35 + SAFR × 0.40 + On-Time Ratio × 0.25. Scale to 0–100.
| Metric | Formula | Governance Use |
|---|---|---|
| Raw Fulfillment Rate | Fulfilled ÷ Total × 100 | Baseline delivery signal |
| Specificity-Adjusted Rate | Weighted fulfilled ÷ weighted total × 100 | Quality-adjusted accountability |
| Median Time-to-Fulfillment | Median(fulfillment date minus promise date) | Execution velocity |
| Composite Execution Score | Weighted composite of RFR, SAFR, on-time ratio | Board scorecard and compensation linkage |
Report 95% confidence intervals alongside each rate when the promise ledger contains fewer than 30 observations in a period. Small ledgers produce unstable rates; narrative context should accompany any quantitative summary in those cases.
Research on CEO promise consequences estimated that each additional broken promise increases the odds of involuntary CEO dismissal by approximately 22%, which gives the fulfillment rate direct relevance to succession risk modeling.
A reproducible five-state rubric and archetype classification
The Five-State Promise Ladder:
| State | Definition | Coding Rule |
|---|---|---|
| Delivered | Fulfillment evidence confirmed within horizon or grace period | Requires documentary proof; binary |
| On Track | Interim evidence of progress; horizon not yet reached | Requires at least one corroborating milestone |
| Delayed with Evidence | Horizon passed; revised timeline provided with documented rationale | Flag external-event if applicable |
| Reinterpreted/Redefined | Scope or metric materially changed post-issuance | Preserve original coding; add redefinition note |
| Not Delivered | Horizon passed; no fulfillment evidence; no revised timeline | Default when evidence is absent |
Archetype Classification:
- Earned: High RFR (above 75%), high SAFR, on-time ratio above 0.70. Delivery consistently matches or exceeds specific commitments.
- Borrowed: High RFR on low-specificity promises only; SAFR materially below RFR. Narrative credibility exceeds demonstrated execution.
- Chronic Slippage: Repeated "Delayed with Evidence" or "Reinterpreted" states across multiple periods; RFR appears moderate but on-time ratio is low.
- Aspirational: High proportion of vague promises, low promise density, low SAFR. Commitments function as directional signals rather than accountable targets.
Archetype classification informs investor action: an "Earned" company warrants lower governance risk premium; a "Borrowed" company signals potential narrative-to-execution gap that may reprice on a missed quarter.
How boards and investors should interpret and act on fulfillment metrics
A fulfillment rate below 60% on specific, timeline-bound promises is a material governance signal, not a performance footnote. Boards that treat it as the latter typically encounter the year-end surprises that ACHE's continuous evaluation framework is explicitly designed to prevent.
High-performing boards conduct midyear dashboard reviews, use 360-degree inputs, and link CEO goals directly to compensation structures. Fulfillment rate metrics integrate naturally into that cadence: the SAFR and composite execution score belong on the midyear dashboard, while archetype classification informs the annual compensation committee deliberation.
Board questions to surface in performance reviews:
- Which specific promises moved to "Delayed" or "Reinterpreted" since the last review, and what documentary evidence supports the revised timeline?
- Is the SAFR diverging from the RFR? If so, is the CEO systematically fulfilling only low-specificity commitments?
- Has the promise density in earnings calls declined? Declining density may signal anticipatory vagueness under uncertainty.
Pro Tip: Link the composite execution score explicitly to the short-term incentive formula. ClientWise's CEO scorecard guidance recommends quarterly target reviews; building the fulfillment rate into that quarterly cycle creates a documented, defensible compensation rationale.
Known measurement challenges and how to reduce bias
- Low-specificity language. CEOs increase vagueness under uncertainty; a rising proportion of specificity-score-1 promises is itself a signal, not merely measurement noise. Specificity weighting in the SAFR captures this directly.
- Attribution across organizational units. When a commitment is made by a division head and ratified by the CEO, apply a shared-attribution rule and document it in the coding appendix.
- Extended horizons. Multi-year ESG and strategic promises remain open across multiple reporting periods. Use survival analysis rather than excluding censored promises; exclusion biases the RFR upward.
- Exogenous shocks. Macro events (pandemic, regulatory reversal, supply-chain disruption) can invalidate delivery feasibility. Apply external-event flags with documented criteria; do not retroactively reclassify "Not Delivered" as "Delayed with Evidence" without contemporaneous documentation.
- Inter-rater drift. Coding rules that seem clear at inception become ambiguous as edge cases accumulate. Quarterly kappa checks and a maintained coding appendix are the primary controls.
Pro Tip: Treat a sudden spike in "Reinterpreted/Redefined" states as a governance risk indicator. Systematic redefinition of prior commitments is the behavioral signature of disclosure opacity, not external adversity.
Operationalizing the measurement: a governance checklist
- Establish a transcript and filing repository. Store timestamped copies of all earnings-call transcripts and SEC filings for the coverage universe. Use SEC EDGAR for filings; maintain a separate archive for call transcripts with source URLs.
- Build and version the promise ledger. Create a structured database with fields for verbatim text, speaker, source, date, specificity score, horizon, topic category, and fulfillment state. Version each quarterly snapshot.
- Assign roles. Board chair or lead director: owns the annual fulfillment review and archetype classification. Compensation committee: integrates SAFR and execution score into incentive deliberations. Governance lead or head of IR: maintains the ledger and produces quarterly dashboard updates.
- Set the review cadence. Quarterly promise review (new promises logged, horizon-due promises verified), midyear check-in (dashboard review with board), annual formal audit (full ledger reconciliation, archetype update, inter-rater kappa calculation).
- Produce the dashboard. Minimum dashboard items: RFR and SAFR by period, composite execution score trend, promise state distribution (five-state ladder), archetype classification, and a list of promises moving to "Delayed" or "Not Delivered" since the prior review.
- Benchmark against sector peers. A single-company fulfillment rate is interpretable only in peer context. Public company accountability benchmarks provide the sector reference frame needed to distinguish company-specific execution risk from industry-wide delivery patterns.
Why forensic measurement changes the governance calculus
The conventional approach to CEO evaluation treats promise-keeping as a qualitative judgment made once a year, usually in the weeks before a compensation decision. That timing guarantees recency bias and narrative capture. A continuous, audit-traceable fulfillment ledger changes the information structure of the board relationship: directors arrive at every review with a documented record, not a reconstructed impression.
The practical consequence is visible in how boards handle the "Delayed with Evidence" state. When a promise moves to that state mid-year, a board with a live ledger can engage the CEO immediately, request the revised timeline, and document the rationale before the annual review. A board without one discovers the slip at year-end, when the compensation decision is already politically fraught. ACHE's guidance frames this as a partnership model: continuous evaluation is not surveillance but a mechanism for keeping strategy and execution aligned in real time.
The deeper insight is that the fulfillment rate does not merely measure past delivery. A declining SAFR, rising promise vagueness, and increasing "Reinterpreted" states are leading indicators of an aspiration-to-execution gap that will eventually surface in financial results. Boards and investors who track these signals forensically tend to see the gap before the market does.
Lacunaindex turns this methodology into a subscription workflow
Lacunaindex applies the forensic pipeline described in this guide to public companies across sectors, producing audit-traceable reports that institutional subscribers receive as structured deliverables rather than manual projects.

Each Lacunaindex report includes a promise ledger sourced verbatim from earnings calls, 10-K and 8-K filings, and press releases; an execution score and SAFR calculated under a documented, versioned methodology; archetype classification (Earned, Borrowed, Chronic Slippage, Aspirational); and a narrative-versus-delivery delta that surfaces the aspiration-to-execution gap in a format ready for board presentation or investment committee review. Sector benchmarks are available at no cost and provide the peer reference frame needed to contextualize any single-company score. Subscribers gain access to full company-level forensic reports and the underlying promise ledger. To request access or review available sector coverage, visit the benchmarks page and use the subscription inquiry form.
Sources
- The Power and Peril of CEO Promises
- SMJ article on computational promise analysis
- Evaluating the Performance of the Hospital or Health System CEO | American College of Healthcare Executives
- Effective CEO Performance Evaluation | AHA Trustee Services
- Your Guide to an Effective CEO Performance Review | DDI
This article is general information, not a substitute for advice from a qualified financial advisor. Consult a qualified financial professional about your own circumstances before acting on anything here.