
Narrative-driven market mispricing is a valuation gap that emerges when a company's engineered public narrative persistently diverges from its operational delivery, causing market prices to reflect communicated aspiration rather than delivery-adjusted fundamentals. The five highest-yield forensic signals to screen for are: editorial drift (systematic prose changes across D1–D6 scoring dimensions), graph distortion (selective visual presentation of financial data), tone dispersion (widening spread of sentiment language within disclosures), hedge proliferation (accelerating frequency of uncertainty qualifiers), and framing drift (shifting emphasis across reporting periods). The first operational step is to score a candidate company's 10-K/10-Q filings, earnings call transcripts, and press releases against a weighted forensic rubric using Lacunaindex's methodology, then prioritize for engagement any firm where two or more signals co-occur across formats.
Persistent market narratives generate a measurable "narrative risk premia" that correlates with volatility spikes and regime-dependent mispricing, as documented by the Market Narrative Intensity Index research — meaning the valuation gap is not merely a perception problem but a priced, correctable distortion.
Key Takeaways
Narrative-driven market mispricing is measurable, sector-patterned, and most reliably detected when forensic signals co-occur across unscripted formats and correlate with delivery KPI deterioration.
| Point | Details |
|---|---|
| Editorial drift accelerated 25% | The 2019–2024 sample shows a significant rise in prose drift rates, with hedge proliferation and sentence inflation as primary mechanisms. |
| Cross-format co-occurrence is decisive | Signals that appear in both prepared filings and unscripted Q&A carry the highest evidentiary weight for asserting mispricing. |
| Governance quality drives variance | Editorial governance quality explains more variance in drift scores than sector or firm size, making governance screening the most efficient entry point. |
| Triangulation is mandatory | Forensic scores require confirmation from delivery KPIs and unscripted divergence across at least two periods before supporting investment or governance action. |
| Lacunaindex provides the audit trail | Lacunaindex maps each signal to a specific filing passage, producing evidence logs suitable for engagement, proxy briefings, and journalistic citation. |
Table of Contents
- What narrative-driven mispricing actually measures
- The forensic signals that reveal a narrative-delivery gap
- Building the measurement pipeline from raw documents to a forensic score
- What the 2019–2024 evidence base shows
- How to read signals without misclassifying benign changes
- A practical playbook for investors, proxy advisors, and journalists
- A composite worked example: mapping signals to an archetype
- Methodology, sample frame, and limitations
- Why narrative forensics deserves a permanent place in due diligence
- Lacunaindex operationalizes this forensic workflow
- Primary sources and further reading
- Sources
What narrative-driven mispricing actually measures
Market mispricing, as used throughout this analysis, refers specifically to the gap between a company's prevailing market price and its delivery-adjusted intrinsic value, where that gap is caused or sustained by engineered or persistently optimistic corporate narrative rather than by genuine information asymmetry or option value. This definition excludes policy-level regulatory impact analyses (RIAs) and macroeconomic pricing models entirely.
The public records in scope are:
- Form 10-K and 10-Q (annual and quarterly SEC filings)
- Earnings call transcripts, separated into prepared remarks and unscripted Q&A
- Press releases and investor presentations
- Proxy statements (DEF 14A)
- EDGAR filing metadata and version histories
Two contrasting archetypes illustrate the boundary. An undervalued company shows improving delivery KPIs (margin expansion, free cash flow conversion) while its disclosure language remains cautious or lagging, producing a narrative-to-delivery discount. A borrowed-narrative company shows the reverse: aspirational language, elevated valuation multiples, and stagnant or deteriorating operational metrics. Valuation models must also control for the "other information" term (𝜗) identified in residual income frameworks, which captures value beyond bottom-line accounting numbers and can otherwise be mistaken for a narrative-engineered gap.
Lacunaindex operationalizes this measurement by scoring disclosures across six prose dimensions and mapping the result to one of three archetypes: earned, borrowed, or undervalued.
The forensic signals that reveal a narrative-delivery gap
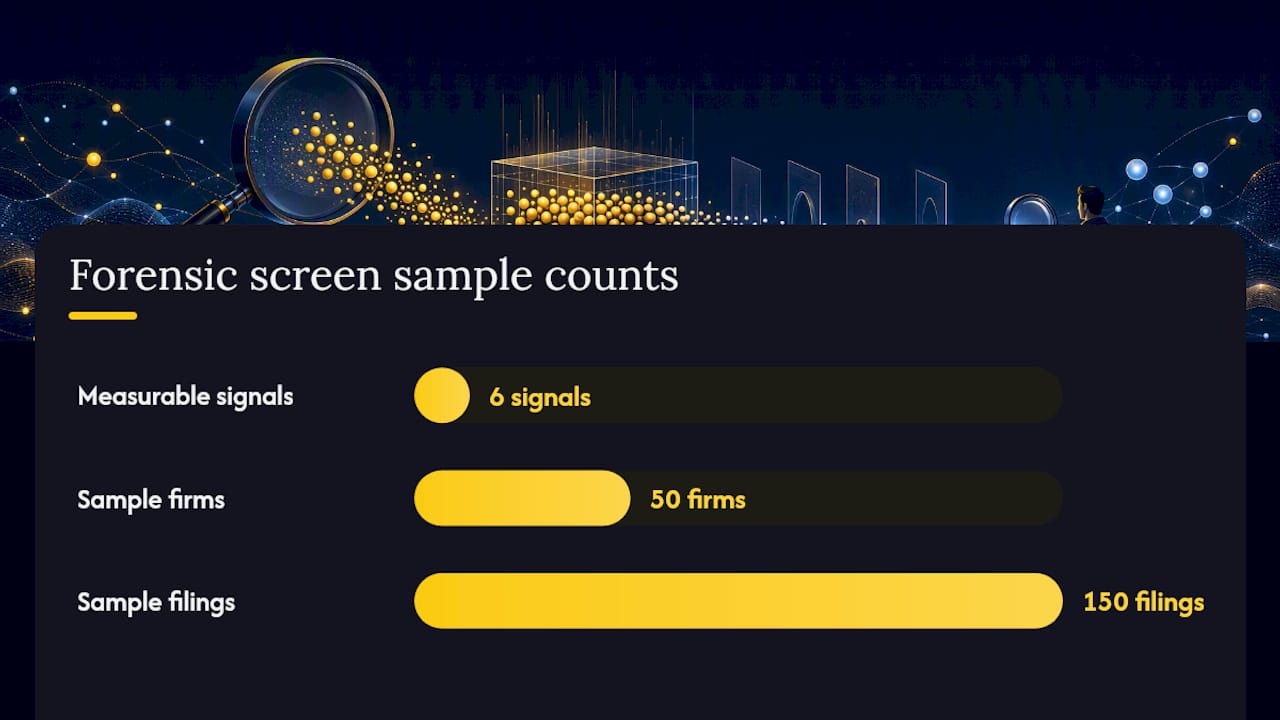
Six measurable signals form the core of a narrative-vs-delivery forensic screen. Each has a distinct metric recipe and a different diagnostic weight.
- Editorial drift is the primary composite signal: a weighted change score across six prose dimensions (D1 specificity, D2 hedge density, D3 framing tone, D4 sentence complexity, D5 forward-looking claim density, D6 accountability language). A drift score above threshold across three or more dimensions in consecutive filings is the strongest single indicator.
- Hedge proliferation tracks the ratio of uncertainty qualifiers ("may," "could," "subject to") per 1,000 words. Rising hedge density without a corresponding increase in disclosed risk factors suggests defensive drafting rather than genuine uncertainty disclosure.
- Framing drift measures the shift in emphasis between operating metrics and aspirational language across periods. A company that progressively leads with vision statements while burying margin data is exhibiting framing drift.
- Sentence inflation quantifies average sentence length and syntactic complexity over time. Longer, more convoluted sentences in later filings relative to earlier ones correlate with deliberate obfuscation, as readability research using Coh-Metrix features has documented.
- Tone dispersion measures the spread of sentiment-bearing words within a narrative. A high dispersion score, where positive and negative tone words cluster in different sections rather than distributing evenly, correlates with current and future firm performance and affects analyst responses to conference-call narratives.
- Graph distortion applies a PGDI-style (Pictorial Graph Distortion Index) measure to charts embedded in annual reports and investor presentations. Thematic narrative bias and graph distortion are positively associated in 10-K filings, with the association strengthening materially under weak governance conditions.
Pro Tip: Weight graph distortion and unscripted Q&A tone dispersion more heavily in initial screening. Both are harder to legally review before publication, making them less susceptible to counsel-driven normalization.
Building the measurement pipeline from raw documents to a forensic score
The operational pipeline runs from document ingestion through to an audit-traceable composite score. Primary sources, their extractable signals, and suggested review cadence are mapped below.
| Source | Signals Extractable | Suggested Frequency |
|---|---|---|
| Form 10-K | Editorial drift (D1–D6), graph distortion, hedge density | Annual; compare year-over-year |
| Form 10-Q | Hedge proliferation, framing drift, sentence inflation | Quarterly; flag inter-period shifts |
| Earnings call (prepared) | Framing drift, forward-looking claim density | Quarterly; baseline for Q&A comparison |
| Earnings call (Q&A) | Tone dispersion, unscripted divergence, hedge density | Quarterly; highest diagnostic weight |
| Press releases | Framing drift, specificity score | Per release; compare to concurrent filings |
| Proxy statement | Accountability language, governance signal | Annual; governance moderator input |
The end-to-end pipeline proceeds as follows: ingest raw documents from EDGAR and company IR pages; normalize text (strip boilerplate, legal headers, and XBRL tags); apply NLP scoring for hedge density, specificity, tone dispersion, and sentence complexity; extract embedded graphs and compute PGDI scores; aggregate dimension scores into a weighted composite; and generate an immutable evidence log with version-controlled scoring rules.
Unscripted Q&A in earnings calls provides the strongest diagnostic signal because it lacks the legal review applied to prepared remarks, making authentic delivery gaps more likely to surface in linguistic and vocalic features.
Pro Tip: Maintain a versioned, immutable evidence log for every scoring run. When a company revises its disclosure language after engagement, the log provides the before-and-after audit trail needed for governance escalation or journalistic citation.
What the 2019–2024 evidence base shows
The 50-firm, 150-filings prose-drift study documents a clear directional pattern: editorial-prose drift accelerated in the later interval (2022–2024) relative to the earlier one (2019–2022), with the aggregate rate rising roughly 25%. Dimension-level results identify hedge proliferation and sentence inflation as the dominant mechanisms, while specificity scores (D1) declined across the sample.
Sector patterns from the study are indicative rather than definitive, given the sample size:
- Technology and industrials show accelerated late-period drift, with framing drift and forward-looking claim density rising most sharply after 2022.
- Financials exhibit different timing, with hedge proliferation concentrated in the 2019–2022 interval, likely reflecting pandemic-era regulatory language requirements.
- Governance as the primary moderator: prose drift is uneven across firms and sectors, and editorial governance quality explains more variance than sector or firm size alone, making governance-focused screening for high-risk narrative companies especially productive.
Cross-channel tonal inconsistency is a non-random marker of poor firm performance and often precedes downward price drift as markets reprice the divergence between narrative and delivery. This finding elevates cross-format divergence to a high-conviction signal in any screening protocol.
How to read signals without misclassifying benign changes
Not every increase in hedge density or sentence length reflects opportunistic impression management. Responsible interpretation requires ruling out four common alternative explanations before asserting mispricing.
Red flags that increase conviction:
- Coordinated bias across multiple formats (10-K prose, investor presentation graphs, and earnings call tone all shift in the same direction in the same period)
- Unscripted Q&A diverges materially from prepared remarks on the same operational topic
- Drift persists across three or more consecutive reporting periods without a corresponding change in disclosed risk factors
- Delivery KPIs (revenue growth, margin, free cash flow) stagnate or deteriorate while narrative scores rise
Common benign explanations to rule out first:
- New SEC disclosure requirements (e.g., cybersecurity incident disclosure rules effective 2023) that mandate additional hedged language.
- Legal counsel-driven house-style changes following litigation or regulatory inquiry
- AI-assisted drafting adoption, which can inflate sentence complexity and alter tone distribution without managerial intent
- Genuine strategic pivots that legitimately require more forward-looking language
The downgrade checklist before asserting mispricing: confirm delivery KPI deterioration in at least two consecutive periods; verify that graph distortion and prose drift co-occur (not just one); check that unscripted Q&A diverges from prepared remarks; and review regulatory oversight gaps that may explain structural language changes.
Pro Tip: Signals that persist in unscripted formats and correlate with delivery KPI deterioration carry the highest evidentiary weight. A single anomalous filing rarely justifies action; three consecutive periods of co-occurring signals across formats do.
A practical playbook for investors, proxy advisors, and journalists
The following sequence converts forensic signals into prioritized, defensible actions.
- Screen the universe using a weighted composite forensic score (editorial drift weighted 40%, tone dispersion 25%, graph distortion 20%, hedge proliferation 15%). Flag firms scoring above the sector benchmark threshold.
- Prioritize by valuation gap and liquidity. A high forensic score in a large-cap, liquid name with elevated price-to-fundamentals multiples represents the highest-value engagement target.
- Validate with delivery KPIs. Pull revenue growth, operating margin, and free cash flow conversion for the same periods as the flagged filings. Use disclosure gap analysis to map narrative claims to reported outcomes.
- Engage management with specific, evidence-referenced questions. For investors: "Your 10-K forward-looking claim density rose 34% between 2022 and 2024 while operating margin contracted — can you walk through the specific initiatives that bridge that gap?" For proxy advisors: benchmark against sector peers before voting on compensation plans tied to narrative-heavy targets.
- Escalate when signals persist post-engagement. Triggers for formal governance action include: management unable to provide specific operational evidence for narrative claims; graph distortion confirmed in two consecutive annual reports; unscripted Q&A divergence documented across multiple calls.
For journalists, the validation sequence is: obtain the EDGAR filing, extract the specific claim, locate the corresponding KPI in the financial statements, and document the gap with a timestamped evidence log before publication. The forensic view on public disclosures provides additional guidance on verifying corporate claims without insider access.
A composite worked example: mapping signals to an archetype
The following anonymized composite represents a mid-cap technology company with elevated valuation multiples and a multi-period pattern of prose drift.

Archetype classification: Borrowed Narrative. High editorial drift combined with above-median graph distortion, below-sector delivery KPIs, and elevated price-to-sales multiples places this composite firmly in the borrowed-narrative zone. The 𝜗 term check confirms no material unrecognized intangible value that would justify the premium.
Recommended actions: initiate engagement requesting specific operational evidence for forward-looking claims; flag for proxy advisor review of compensation metrics tied to narrative targets; reduce portfolio weight until delivery KPIs converge toward sector median or narrative scores normalize.
Methodology, sample frame, and limitations
Scoring rubric summary: Six prose dimensions (D1–D6) are scored on a 0–1 scale per filing; graph distortion uses a PGDI-style continuous measure; tone dispersion uses a within-document sentiment spread calculation. Dimension weights are fixed and version-controlled. Every score is tied to a specific text passage or graph in an immutable evidence log.
Sample frame: The core study covers 50 firms and 150 filings, sampling 2019, 2022, and 2024 periods. Results are directionally robust but not statistically generalizable across all sectors or market-cap bands.
Limitations analysts must acknowledge:
- Sample size limits sector-level precision; treat sector patterns as hypothesis-generating, not confirmatory
- Mandatory disclosure changes (SEC cybersecurity rules, climate disclosure proposals) alter baseline language and require period-specific controls
- AI-assisted drafting adoption post-2022 may inflate sentence complexity and alter tone distribution independently of managerial intent
- Forensic scores measure correlation between narrative and delivery gaps, not causation; price correction timing is not predictable from scores alone
- The 𝜗 term in residual income valuation must be estimated separately to avoid conflating genuine option value with narrative-engineered gaps
Triangulation protocol: combine a forensic composite score above sector threshold with at least two consecutive periods of delivery KPI deterioration and confirmed unscripted Q&A divergence before treating a signal as investment-grade evidence.
Why narrative forensics deserves a permanent place in due diligence
The conventional due diligence workflow treats corporate disclosures as a data source rather than a signal. That framing misses the diagnostic layer entirely. When management coordinates language across prepared filings, investor presentations, and earnings call scripts, the resulting consistency is not evidence of transparency — it is evidence of message discipline. The genuinely diagnostic material surfaces in the gaps: between prepared and unscripted remarks, between graph selection and reported numbers, between the specificity of claims made in year one and the vagueness of accountability language in year three.
The 2019–2024 drift evidence makes the case empirically. It is a measurable shift in how management chooses to communicate during a period when delivery metrics, for many firms, failed to keep pace with narrative ambition. Fiduciaries who treat that shift as background noise are accepting a systematic blind spot. The more defensible posture is to score it, triangulate it with KPIs, and engage with specific evidence rather than rhetorical rebuttal.
Lacunaindex provides the operational infrastructure for exactly that posture.
Lacunaindex operationalizes this forensic workflow
Lacunaindex delivers the full forensic pipeline described above as a subscription analytics platform, built exclusively on public records and designed for institutional-grade evidentiary standards. Each company report includes a scored editorial-drift profile across D1–D6 dimensions, a PGDI-based graph distortion measure, tone-dispersion calculations, archetype classification (earned, borrowed, or undervalued), and an audit-traceable evidence log that ties every score to a specific passage or exhibit in the source filing.

Sector benchmarks are publicly accessible at Lacunaindex and provide the peer-context needed to calibrate whether a company's forensic score represents a genuine outlier or sector-normal drafting practice. For analysts and governance professionals who need company-level forensic reports, the Lacunaindex user guide explains the scoring components in detail and outlines how to request a full company-level report. The evidence log format is designed to support investor engagement letters, proxy advisor briefings, and journalistic citation without requiring insider access or proprietary data.
Primary sources and further reading
- Narrative Risk Premia: How Persistent Market Narratives Generate Volatility and Mispricing — theoretical and empirical basis for the narrative risk premia concept and the Market Narrative Intensity Index
- Impression management strategy: thematic bias and graph distortion — S&P 500 10-K evidence on coordinated narrative and graph distortion under weak governance
- Strategic tonal inconsistency in corporate messaging — cross-channel tonal inconsistency as a marker of poor performance and precursor to price drift
- Estimating the 'other information' (𝜗) term — valuation methodology for separating genuine option value from narrative-engineered gaps
- Lacunaindex sector benchmarks — free public benchmarks for contextualizing company-level forensic scores
- Analyze company disclosure inconsistencies: analyst toolkit — operational checklist for validating narrative-vs-delivery gaps
This article is general information, not a substitute for advice from a qualified financial advisor. Consult a qualified financial professional about your own circumstances before acting on anything here.
Sources
- Strategic tonal inconsistency in corporate messaging is a non-random marker of poor firm performance
- Narrative Risk Premia: How Persistent Market Narratives Generate Volatility and Mispricing
- Impression management strategy — The relationship between accounting narrative thematic bias and financial graph distortion
- Estimating the ‘other information’ (𝜗) that bridges prices and accounting numbers