
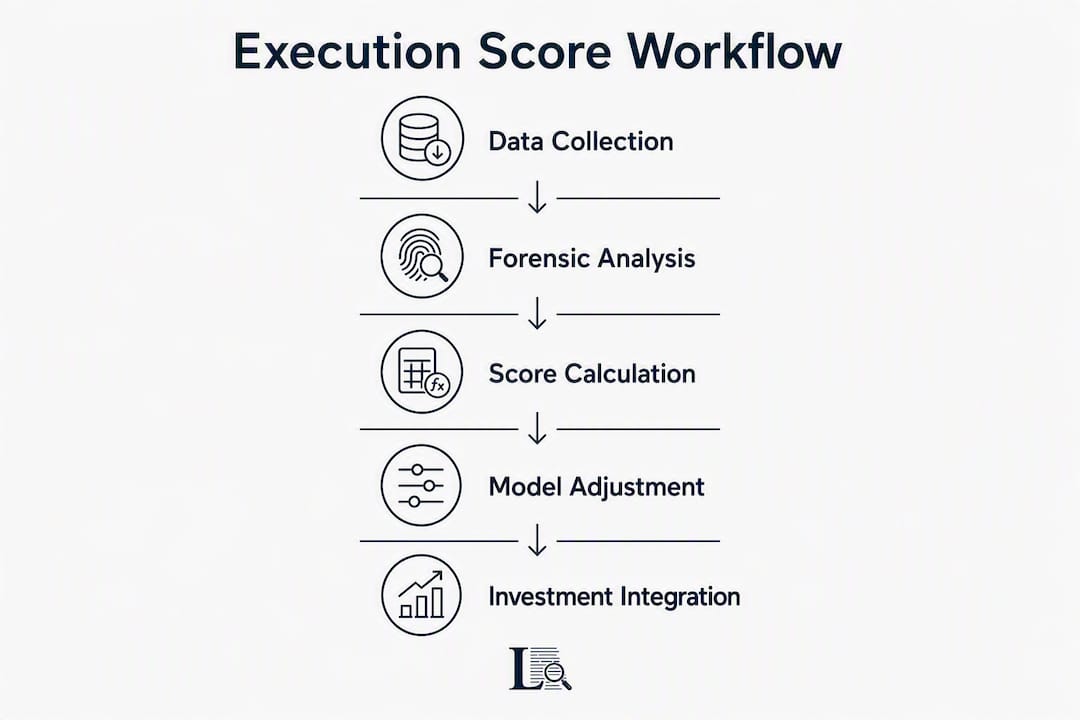
The most direct path to separating corporate narrative from actual delivery is to incorporate Lacuna execution scores as an orthogonal signal inside your existing equity research workflow, applying them at five decision points: universe screening, forensic research routing, model adjustment, monitoring cadence, and engagement escalation. Treat the execution score as a continuous risk discount applied to forward operating assumptions until evidence closes the aspiration-to-execution gap.
TL;DR for immediate adoption:
- Screening trigger: Flag any company whose execution score falls more than one standard deviation below its sector benchmark for forensic review.
- Model adjustment rule: Reduce revenue growth assumptions and increase downside scenario probability in proportion to the measured gap; apply an asymmetric penalty because narrative engineering skews short-term signals optimistic.
- Monitoring cadence: Re-score on each 10-K and 10-Q filing cycle; escalate to engagement if the gap widens across two consecutive periods.
- Engagement criterion: Prioritize companies classified as "Borrowed" (strong narrative, weak delivery) where the gap has persisted for three or more years.
Table of Contents
- How do execution scores change what research signals actually mean?
- What do Lacuna execution scores actually measure?
- How do you integrate execution scores into a full research workflow?
- How do you translate an execution score into concrete model adjustments?
- What operational steps does implementation require?
- Which use cases produce the biggest lift from execution scores?
- What are the key limitations and pitfalls to avoid?
- How do you validate execution scores inside your investment process?
- How does Lacunaindex implement execution scores, and how do you read a report?
- Key Takeaways
- Why the gap between narrative and delivery is the most underpriced risk in institutional research
- Lacunaindex forensic execution scores: access and onboarding
- Selected primary sources and further reading
How do execution scores change what research signals actually mean?
The core information problem is that corporate disclosures, particularly earnings call transcripts and press releases, are increasingly engineered to manage investor perception rather than transmit new quantitative facts. Research on earnings call narrative dimensions demonstrates that six linguistic dimensions, including guidance framing, jargon density, confidence, and uncertainty, materially affect analyst forecast revisions and realized earnings outcomes. A model using those six dimensions captured roughly 40% of the out-of-sample performance of full text embeddings, confirming that narrative structure carries substantial information content beyond the numbers themselves.
The mispricing mechanism compounds when investor attention is limited. Multi-dimensional narrative complexity interacts with investor distraction to delay price adjustment: the Aggregate Attribute Index interaction with distraction corresponds to a measurable negative cumulative abnormal return over short and longer horizons at sample means. Execution scores distill that multi-dimensional signal into a single auditable metric, reducing the attention burden on analysts.
Disclosure mimicry amplifies the false-positive rate in narrative-only screening. A study of 828 U.S.-listed firms using ClimateBERT classifiers found convergence in disclosure styles consistent with mimicry, meaning firms can appear aligned with peers without any real change in delivery. Execution scores that anchor to verifiable public-record evidence, rather than linguistic style alone, cut through that mimicry.
| Study finding | Effect magnitude |
|---|---|
| Uncertainty narrative vs. analyst reaction (PTEs) | Larger negative effect on realized outcomes than analyst revision |
| Distraction × narrative complexity | Associated with delayed negative cumulative abnormal returns |
| GIS narrative-performance gap predicting negative CAR | Statistically significant negative association |
| GIS sample classified as "Greenwashing Risk" | A notable minority of sample firms |
The Greenwashing Intelligence System study across 4,642 firms (2019–2026) found that only 23.5% qualified as Aligned Leaders, while 31.7% were classified as Disengaged and 16.0% as Greenwashing Risk. A narrative-performance gap score significantly predicted negative CARs, increased litigation risk, and media-sentiment deterioration.
What do Lacuna execution scores actually measure?
Lacuna execution scores quantify the aspiration-to-execution gap: the distance between what a company claims in public disclosures and what verifiable public records confirm it has delivered. The score has two primary components.

The narrative proxy aggregates linguistic signals from earnings call transcripts, press releases, and investor-day materials, capturing guidance specificity, confidence register, and forward-looking commitment density. The delivery proxy draws from SEC filings (10-K, 10-Q, proxy statements), regulatory filings, supply-chain public records, litigation dockets, and incident disclosures. The gap between the two is standardized within sector to produce a percentile score that is directly comparable across companies in the same industry.
Evidence sources used in scoring:
- SEC filings: 10-K annual reports, 10-Q quarterly reports, DEF 14A proxy statements
- Earnings call transcripts and investor-day presentations
- Press releases and public guidance statements
- Regulatory filings and enforcement records
- Supply-chain and operational public records
- Litigation filings and material incident disclosures
Archetype classification follows from the gap score:
- Earned: Narrative and delivery are aligned; the company's public claims are substantiated by verifiable outcomes. Low delivery risk; model assumptions can carry standard confidence intervals.
- Borrowed: Strong narrative, weak delivery. The company's public commitments consistently outpace confirmed outcomes. Apply a delivery-risk penalty to forward assumptions.
- Undervalued: Weak narrative, strong delivery. The company underrepresents its operational performance in public communications. A potential source of mispriced upside.
Every score carries an audit trail of traceable evidence links, making the classification reproducible and defensible in committee presentations. You can review public-record evidence sourcing for a detailed breakdown of how each evidence type maps to score components.
Pro Tip: Separate short-term narrative swings from multi-year delivery trends. Use a 3–4 year rolling window to distinguish transient managerial framing from structural delivery change; quarterly narrative shifts are too noisy to drive archetype reclassification.
How do you integrate execution scores into a full research workflow?
- Universe screening. Add an execution-score filter to your initial screen. Companies more than one standard deviation below their sector benchmark enter a forensic research queue automatically. This replaces ad hoc narrative review with a systematic triage.
- Forensic research routing. Assign flagged names to analysts with a forensic checklist: required evidence links, red-flag indicators (widening gap across consecutive filings, sudden narrative alignment with sector peers), and a minimum documentation standard before a delivery gap can be closed.
- Model prior adjustment. Annotate the model with the current execution score and archetype. Apply the delivery-risk penalty to revenue growth and margin assumptions (see the modelling section below). Record the adjustment rationale in the model audit log.
- Monitoring threshold and cadence. Set automated alerts for score changes exceeding half a standard deviation on each filing cycle. Re-run the archetype classification after each 10-K. A gap that widens across two consecutive periods triggers escalation.
- Engagement and governance escalation. Persistent "Borrowed" classification over three or more years, or a sudden gap widening coinciding with a major capital event, routes the name to the engagement or governance team with a pre-populated evidence dossier.
Forensic checklist for research analysts:
- Confirm at least three independent evidence links per delivery proxy claim
- Document the filing date and version for each source
- Flag any disclosure where narrative specificity increased without a corresponding operational disclosure
- Record analyst sign-off date and score version used
Pro Tip: Automate the triage layer (score thresholds combined with volatility filters) but keep human verification for archetype classification and all engagement decisions. Automated routing reduces analyst time on low-signal names; human judgment remains necessary where sector context or regulatory idiosyncrasies affect score interpretation.
How do you translate an execution score into concrete model adjustments?
The adjustment logic follows a straightforward rule: the wider the aspiration-to-execution gap, the larger the downside penalty applied to forward operating assumptions. Apply asymmetric adjustments because uncertainty narratives produce larger negative realized-outcome effects than analysts typically price in (–41.09 bps realized versus –9.22 bps analyst revision in the PTE experiments).
Three-line model walkthrough:
- Revenue growth: Reduce the base-case growth rate by a delivery-risk factor proportional to the gap percentile. A company at the 75th percentile of gap (wide gap) warrants a more conservative base case than sector peers.
- Operating margin: Compress the terminal margin assumption toward the sector median when delivery scores have trended below narrative for three or more consecutive years.
- Terminal value: Apply a higher discount rate or a lower terminal growth rate for "Borrowed" archetypes, reflecting the probability that the narrative premium in the current multiple will mean-revert as delivery gaps become visible to the broader market.
| Gap percentile | Revenue growth adjustment | Downside scenario weight | Terminal value treatment |
|---|---|---|---|
| Narrow gap | No adjustment | Standard | No adjustment |
| Below median | Modest reduction | Modestly elevated | Monitor; no change |
| 50th–75th | Moderate reduction | Elevated | Compress terminal margin |
| Above 75th (wide gap) | Material reduction | Materially elevated | Reduce terminal growth rate |
Pro Tip: When backtesting these adjustments, apply asymmetric penalties: larger downside adjustments for wide-gap companies than upside adjustments for narrow-gap ones. Narrative engineering produces systematically over-optimistic short-term signals, so symmetric adjustments understate the risk.
What operational steps does implementation require?
Embedding execution scores into a live research operation involves four practical workstreams.
Data ingestion and version control. Lacunaindex supports both API access and scheduled CSV exports. API delivery suits event-driven workflows where a new filing triggers an immediate score update; scheduled exports suit weekly or monthly monitoring cycles. Store each score version with its filing date and evidence-link set so the audit trail is complete.
Reporting and permissions:
- Research memoranda: include the execution score, archetype, and gap percentile in the standard company header alongside price target and rating
- Committee decks: present the sector percentile chart and the three most material evidence links
- Restricted distribution: raw evidence links and litigation-record citations should carry the same distribution controls as material non-public information protocols, even though the underlying data is public
Compliance checklist:
- Confirm that all evidence sources are publicly available records (SEC EDGAR, court dockets, regulatory databases)
- Record analyst sign-off on each score version used in a published recommendation
- Archive score snapshots at the time of each investment decision for regulatory review
- Document any manual override of an automated archetype classification with a written rationale
Pro Tip: Assign a single owner for execution-score data integrity inside the research team, typically the forensic analyst or a designated data steward. Distributed ownership of score versions creates audit gaps that are difficult to reconstruct after the fact.
Which use cases produce the biggest lift from execution scores?
Execution scores provide the most measurable lift in five specific research and governance tasks.
- Idea generation and narrative-risk screening: Systematic filtering of the investable universe by gap percentile surfaces names that traditional financial screens miss, particularly companies where strong earnings momentum coexists with widening delivery gaps.
- Event-driven forensic research: Capital raises, M&A announcements, and CEO transitions are high-risk narrative moments. A pre-existing execution score provides an immediate prior on whether the company's public framing has historically been substantiated.
- Conviction adjustment in long-only funds: Position sizing that incorporates a delivery-risk discount produces more stable risk-adjusted returns than sizing based on narrative momentum alone.
- Engagement prioritization for governance teams: Proxy advisors and governance professionals can rank engagement targets by gap severity and persistence, concentrating resources on companies where the evidence of delivery shortfall is strongest.
- Investigative reporting: Financial journalists using public disclosures for investigative analysis can use execution scores to identify companies where the narrative-delivery gap has widened ahead of regulatory or litigation events.
Archetype-specific targets include activist-ready names (persistent "Borrowed" classification with a high multiple), index constituents with high gap scores (systematic governance risk), and "Quiet Achievers" where delivery consistently outpaces narrative (potential mispriced upside).
What are the key limitations and pitfalls to avoid?
Execution scores are powerful but not infallible. Misuse typically follows predictable patterns.
- Overreacting to short-term narrative noise: A single quarter of elevated narrative language does not constitute a structural gap. Require at least two consecutive periods before adjusting an archetype classification.
- Survivorship bias: Backtests that exclude delisted or acquired companies overstate signal reliability. Include the full historical universe.
- Proxy dependence: Switching disclosure proxies can reduce model fit dramatically, with adjusted R² falling from 0.235 to 0.087 in one study when moving from CDP to LSEG data for the same firm sample. Require stability across at least two independent proxies before treating a gap as confirmed.
- Mimetic disclosure: When an entire sector converges on similar disclosure language, peer-relative gap scores become less informative. Supplement with absolute delivery metrics.
Sector sensitivities:
- Less informative: Early-stage biotechs (limited operational public records), regulated utilities (accounting idiosyncrasies distort delivery proxies)
- Most informative: Energy, Materials, and Industrials, where operational public records are dense and verifiable
Pro Tip: For sectors with thin public-record coverage, weight the delivery proxy more heavily toward regulatory filings and litigation records, and reduce reliance on supply-chain proxies that may not be publicly disclosed.
Additional red flags requiring caution: index-membership-driven disclosure premiums (companies that improve disclosure quality upon index inclusion without operational change), sudden narrative alignment with sector peers following a governance event (mimicry rather than real convergence), and fragile proxy results that do not replicate across disclosure datasets.
How do you validate execution scores inside your investment process?
Validation requires a structured backtest before operational adoption.
- Define the universe and hold periods. Use a survivorship-bias-free universe of U.S.-listed companies. Test across at least two non-overlapping time windows to check out-of-sample stability.
- Build score-based baskets. Construct long/short baskets by gap percentile quartile. Track cumulative abnormal returns, hit rates on downside events (earnings misses, litigation filings, rating downgrades), and information ratio.
- Run return attribution. Decompose performance by sector, market cap, and archetype to identify where the signal is strongest and where it adds noise.
- Perform statistical robustness checks. Control for known confounders (momentum, value, size), bootstrap significance thresholds, and correct for multiple-hypothesis testing. Replicate results across at least two independent disclosure proxies.
| Validation metric | What it measures | Minimum threshold for adoption |
|---|---|---|
| Cumulative abnormal return (CAR) | Alpha generation by gap quartile | Consistent positive spread, wide vs. narrow gap |
| Hit rate on downside events | Predictive accuracy for adverse outcomes | Above base rate across two time windows |
| Information ratio | Risk-adjusted signal quality | Positive and stable out-of-sample |
| Proxy replication | Signal robustness across disclosure datasets | Significant across at least two proxies |
Multimodal GIS architecture combining text, verified operational data, and incident records achieves classification agreement with expert panels at Cohen's κ = 0.65–0.78, providing a useful external benchmark for validating your own scoring framework. The practical validation rule: require consistent out-of-sample improvement across at least two different disclosure proxies or time windows before moving to operational adoption.
How does Lacunaindex implement execution scores, and how do you read a report?
Lacunaindex produces per-company forensic reports built entirely from public records, with every score component linked to a traceable evidence source. The report structure covers five panels.
- Narrative score panel: Linguistic analysis of earnings calls, press releases, and investor-day materials, scored against sector peers and expressed as a percentile.
- Execution score panel: Delivery proxy drawn from SEC filings, regulatory records, and operational disclosures, standardized within sector.
- Gap visualization: The aspiration-to-execution gap plotted over time, with archetype classification (Earned, Borrowed, or Undervalued) and trend direction.
- Evidence list: Traceable links to each source document supporting the delivery proxy, with filing date and version.
- Engagement priority indicator: A recommended engagement priority based on gap severity, persistence, and sector context.
Sector benchmarks are available without a subscription. Full per-company forensic reports require a paid subscription. The Lacunaindex User Guide maps every report field to standard internal model inputs and provides committee presentation templates.
Onboarding steps:
- Obtain API credentials or configure scheduled CSV exports
- Map Lacunaindex fields to internal model annotation fields (execution score → delivery-risk flag; archetype → position-sizing tier)
- Run a pilot on 20–50 names from the current watchlist or top holdings
- Train analysts on archetype interpretation and the evidence-link audit trail
- Formalize escalation rules for "Borrowed" classifications persisting across two or more filing cycles
Pro Tip: Start the pilot with names where you already have a strong prior from traditional research. Comparing your existing conviction to the execution score on familiar names is the fastest way to calibrate how much weight to assign the signal in your specific process.
The methodology is grounded in forensic corporate analysis principles developed by Glen, Lacunaindex's lead contributor, whose evidence-based approach relies exclusively on public records and produces audit-traceable outputs suitable for regulatory review and committee presentation.
Key Takeaways
Incorporating Lacuna execution scores into equity research requires applying a delivery-risk discount at five decision points: screening, routing, modelling, monitoring, and engagement escalation.
| Point | Details |
|---|---|
| Screening trigger | Flag companies more than one standard deviation below their sector execution-score benchmark for forensic review. |
| Asymmetric model adjustment | Apply larger downside penalties for wide-gap companies; uncertainty narratives produce an average realized effect of –41.09 bps, while analyst revisions average –9.22 bps. |
| Validation requirement | Require consistent out-of-sample improvement across at least two disclosure proxies before operational adoption. |
| Archetype-driven engagement | Prioritize "Borrowed" companies (strong narrative, weak delivery) persisting for three or more years for governance escalation. |
| Lacunaindex adoption path | Use the free sector benchmarks to calibrate, then pilot full forensic reports on 20–50 names via the Lacunaindex User Guide. |
Why the gap between narrative and delivery is the most underpriced risk in institutional research
The conventional view in institutional research treats disclosure quality as a compliance variable, something to check rather than a primary signal. That framing misses the most consistent source of mispricing in public markets. The evidence is clear: narrative dimensions affect realized earnings outcomes at magnitudes analysts systematically underestimate, disclosure mimicry masks real delivery differences across entire sectors, and attention-driven price lags mean the market often takes 30 days or more to incorporate multi-dimensional narrative signals. Execution scoring is not a supplement to fundamental analysis. It is a correction mechanism for the systematic optimism bias that engineered disclosures introduce into analyst models.
The most common objection is that public records are already priced. They are not, consistently. The delay documented in the investor-distraction literature, the proxy fragility findings, and the GIS classification data all point to the same conclusion: the gap between what companies say and what they deliver is a durable, measurable, and exploitable signal. The firms that treat execution scoring as a core research input rather than a governance add-on will have a structural informational advantage over those that do not.
Lacunaindex forensic execution scores: access and onboarding
Institutional research teams that want to operationalize execution scoring without building a proprietary disclosure-mining infrastructure can access Lacunaindex's full forensic report suite through a subscription. The platform delivers audit-traceable execution scores, archetype classifications, sector benchmarks, and evidence-linked company reports built entirely from public records, with no insider access required.

The onboarding path is structured for institutional workflows: trial access covers a pilot scope of 20–50 names, API mapping to internal models is supported with field-level documentation, and analyst training materials are included. The Lacunaindex User Guide provides a complete walkthrough of report panels, field definitions, and committee presentation templates. Sector benchmarks are available at no cost; full per-company forensic reports are gated to subscribers. To request trial access or a demonstration for your research team, contact Lacunaindex directly through the website.
Selected primary sources and further reading
Core academic and practitioner studies referenced in this article:
- Corporate Earnings Calls and Analyst Beliefs (arXiv): ML-based PTE analysis of six narrative dimensions and their effects on analyst forecasts and realized earnings.
- Investor Distraction and Multi-Dimensional Financial Narrative (Review of Accounting Studies): Quantifies attention-driven CAR lags and the incremental information content of disclosure complexity indices.
- Greenwashing Intelligence Systems (IJSRET): Multimodal GIS study across 4,642 firms; GGS predictive power for negative CARs, litigation risk, and media sentiment.
- Same Firms, Different Verdicts: ESG Rating Choice and the Measurement of Greenwashing (arXiv): Proxy fragility analysis; adjusted R² sensitivity when switching disclosure datasets.
- Discourse vs. Emissions: Corporate Narratives, Symbolic Practices, and Mimicry Through LLMs (arXiv): ClimateBERT-based disclosure mimicry study across 828 U.S.-listed firms.
For investment committee presentations, the GIS study and the Review of Accounting Studies paper carry the strongest peer-reviewed authority on narrative-performance gap predictive validity. The arXiv papers on proxy fragility and mimicry provide the methodological grounding for robustness checks and multi-proxy validation requirements.