
Benchmarking disclosure quality across sectors is the process of assessing and comparing corporate transparency using specific quantitative and qualitative metrics derived from recognized frameworks and sector-specific KPIs. The standard industry term for this practice is Corporate Reporting Transparency Quality (CRTQ) assessment, and it encompasses financial, governance, operational, social, and environmental risk dimensions as mandated by IFRS and FASB guidelines. Institutional investors and corporate stakeholders face a persistent challenge: disclosure quality varies sharply across industries, with only about 20–25% of large-cap companies producing climate disclosures rated as comprehensive and decision-useful. Frameworks like CDP, TCFD, CSRD, and IFRS 18 provide reference points, but alignment with any single framework does not guarantee that disclosures are genuinely useful for investment or governance decisions.
What are the prerequisites for benchmarking disclosure quality across sectors?
Effective cross-sector benchmarking starts with a defined set of standardized metrics and reliable data sources. Without these, comparisons collapse into noise. The three non-negotiable data requirements are timeliness, completeness, and assurance scope.
The major disclosure frameworks each address a distinct dimension of transparency. CDP focuses on climate risk and water security. TCFD structures scenario analysis and governance disclosures. CSRD mandates double materiality reporting across European Union filers. IFRS 18 reshapes financial statement presentation to improve the understandability of performance metrics. No single framework covers every dimension an institutional investor needs, which is why cross-framework benchmarking is the standard practice for serious CRTQ assessment.

| Framework | Primary Focus | Mandatory or Voluntary | Key Metric Type |
|---|---|---|---|
| CDP | Climate, water, forests | Voluntary (investor-driven) | Quantitative scores |
| TCFD | Climate risk governance | Voluntary (regulatory-aligned) | Qualitative + scenario |
| CSRD | ESG double materiality | Mandatory (EU filers) | Quantitative + narrative |
| IFRS 18 | Financial statement presentation | Mandatory (IFRS jurisdictions) | Financial disaggregation |
| SEC Climate Rules | GHG and risk disclosure | Mandatory (US public companies) | Quantitative + assurance |
Data sources for benchmarking include SEC filings, proxy statements, earnings call transcripts, ESG rating agency reports, and auditor attestation letters. Each source carries a different reliability profile. Auditor-attested data carries the highest evidentiary weight. Unaudited narrative disclosures carry the lowest.
No universally accepted definition of CRTQ exists in the academic or regulatory literature. This means evaluators must build their own scoring rubrics, anchored to recognized standards but calibrated to sector-specific materiality. Evaluations must prioritize data disaggregation over total pages disclosed for meaningful benchmarking.
Pro Tip: Select KPIs that are sector-relevant, not just framework-compliant. A mining company's Scope 1 emissions disclosure carries more weight than its supply chain narrative. An apparel company's Tier 2 supplier mapping matters more than its carbon intensity ratio.
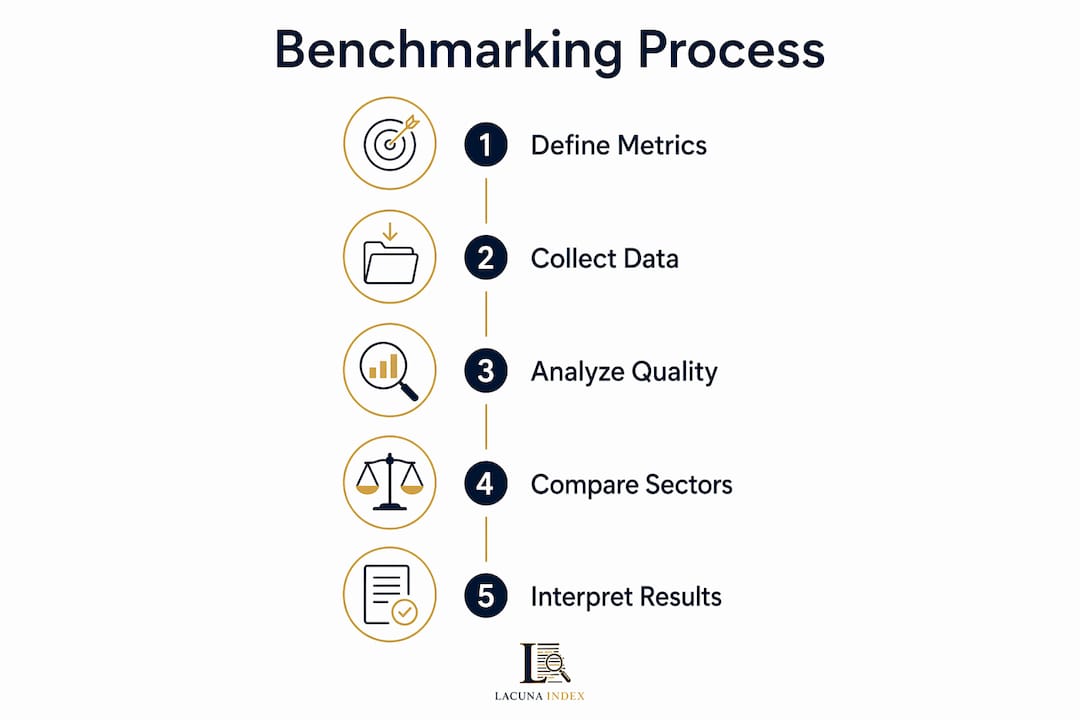
How can you systematically execute a cross-sector benchmarking process?
A disciplined benchmarking process follows five sequential steps. Skipping any step produces results that are directionally misleading rather than analytically useful.
-
Define scope and peer group. Identify the sectors, company size bands, and reporting periods under review. Cross-sector comparisons require explicit peer group definitions to avoid comparing a $500 million specialty chemical firm against a $50 billion integrated energy company on identical metrics.
-
Select indicators by sector materiality. Climate disclosures require metrics like GHG collection cycle length, Scope 3 coverage, and scenario analysis depth. Supply chain disclosures require Tier 1 and Tier 2 supplier mapping rates and audit non-conformance closure rates. GHG data collection cycles range 30–150 days across sectors, which directly affects the timeliness score assigned to any given company.
-
Gather and normalize data. Pull data from regulatory filings first, then supplement with ESG ratings and sector reports. Normalize for reporting period, currency, and organizational boundary. Companies using operational control boundaries produce different Scope 1 figures than those using equity share methods, even for identical physical operations.
-
Score and weight by decision-usefulness. Apply a scoring rubric that weights specificity and financial linkage above narrative volume. Leading companies prioritize specificity and financial linkages over boilerplate narratives. A disclosure that quantifies the financial impact of a 2°C scenario on capital expenditure plans scores higher than one that acknowledges climate risk in general terms.
-
Analyze and interpret gaps. Map scores against sector medians and framework benchmarks. Identify the aspiration-to-execution gap: the distance between what a company claims in its narrative and what its quantitative disclosures actually support. Lacunaindex applies this methodology systematically across public records to produce execution scores that reflect delivery, not intent.
The distinction between quantity and quality is the most consequential judgment call in this process. Electronics companies achieve up to 99% Tier 1 supplier mapping, while apparel companies disclose only about 12% of Tier 2 suppliers. High mapping rates in electronics reflect genuine data infrastructure. Low rates in apparel reflect structural opacity, not just reporting immaturity.
What are the common challenges in benchmarking disclosure quality?
Cross-sector benchmarking surfaces four recurring problems that distort results if left unaddressed.
-
Inconsistent definitions of quality. Without a universal CRTQ standard, different evaluators score the same disclosure differently. Anchoring to IFRS and FASB guidelines reduces but does not eliminate this variance.
-
Volume mistaken for quality. Most stakeholders mistakenly equate high volume with high quality. A 200-page sustainability report with vague qualitative references scores below a 40-page report with quantified financial linkages and auditor attestation.
-
Immature internal controls inflating amendment rates. COSO control maturity ratings differ by sector: 18% in technology to 35% in energy. Early filers show higher restatement and amendment rates because their data collection and verification processes are still developing. Benchmarking early-year filings against mature filers produces misleading quality rankings.
-
False comparability across sectors. Applying identical metrics to a pharmaceutical company and a utility produces category errors. Regulatory filing requirements, materiality thresholds, and assurance expectations differ structurally across industries. Sector-specific calibration is not optional.
Verification strategies that address these problems include reviewing assurance scope letters, tracking amendment rates over multiple reporting cycles, and monitoring audit non-conformance closure rates. Closure rates ranging 50%–88% with a median of 68% within 90 days reveal which companies actually resolve identified issues versus which ones simply pass audits on paper.
Pro Tip: Prioritize audit non-conformance closure rates over audit pass rates when assessing supply chain disclosure quality. A 95% audit pass rate with a 40% closure rate signals a company that manages audit optics, not operational accountability.
How to interpret benchmarking results for investment and governance decisions?
Benchmarking scores become useful only when read in context. A raw score of 65% on a climate disclosure index means little without knowing the sector median, the year-one versus mature-filer baseline, and the assurance depth behind the numbers.
The table below illustrates how the same score translates differently across sectors and use cases.
| Sector | Disclosure Score Range | Sector Median | Investor Implication |
|---|---|---|---|
| Energy | 60%–85% | 72% | High assurance expectation; gaps signal control weakness |
| Technology | 45%–75% | 58% | Lower COSO maturity; early-stage filers need adjustment |
| Apparel | 30%–60% | 44% | Tier 2 opacity is structural; weight Tier 1 closure rates |
| Pharmaceuticals | 55%–80% | 67% | Regulatory filing quality is high; ESG lags financial |
Identifying leaders versus laggards within a sector requires comparing companies against their direct peers, not against a universal standard. A technology company scoring 70% on climate disclosure quality may be a sector leader even though an energy company at 70% is performing at median. SEC climate disclosure readiness shows median scores ranging 50%–65% depending on sector, with restatement rates for year-one filers ranging 5%–30%. That restatement range is a direct indicator of control maturity, not just reporting error.
Linking disclosure quality to financial risk management maturity is the most direct path from benchmarking to portfolio decision-making. A company with high disclosure specificity and low amendment rates demonstrates that its internal data infrastructure is reliable. That reliability reduces the probability of material restatements, which are a documented source of equity price volatility. KPMG emphasizes evaluating notes and disclosures for decision-usefulness, not just mechanical compliance with presentation standards.
Institutional investors can use benchmarking results in direct engagement with portfolio companies. A structured engagement letter that references specific disclosure gaps, for example a company's failure to quantify the financial impact of its stated climate targets, carries more weight than a general request for improved transparency. Lacunaindex produces sector benchmark reports that quantify exactly these gaps, giving investors a factual basis for engagement rather than a qualitative impression.
Key Takeaways
Disclosure quality benchmarking requires sector-calibrated metrics, assurance depth, and a clear distinction between narrative volume and decision-useful specificity.
| Point | Details |
|---|---|
| Define CRTQ before scoring | Anchor your rubric to IFRS, FASB, and sector-specific materiality thresholds before collecting data. |
| Prioritize assurance depth | Auditor-attested data and high closure rates signal genuine data infrastructure, not just reporting compliance. |
| Adjust for sector maturity | Technology and early CSRD filers show structurally lower control maturity; calibrate peer comparisons accordingly. |
| Separate volume from quality | A 40-page report with quantified financial linkages outscores a 200-page narrative with no specificity. |
| Use gaps to drive engagement | Identified disclosure gaps give institutional investors a factual basis for structured company engagement. |
The gap between compliance and quality is wider than most investors realize
The most common mistake I see in disclosure benchmarking is treating framework alignment as a proxy for quality. A company can achieve full TCFD alignment and still produce disclosures that tell you almost nothing about actual financial exposure. TCFD or CDP alignment alone does not guarantee disclosure quality. The true differentiators are deep scenario analysis and internal carbon pricing linked to capital allocation decisions.
What I have found in practice is that the most revealing metric is often the one companies omit. A company that discloses Scope 1 and Scope 2 emissions in detail but provides no Scope 3 estimate is telling you something about where its accountability ends. That omission is a data point, not a gap to overlook.
The push toward multidimensional frameworks is correct, but the execution is still immature across most sectors. Investors who rely on page counts or framework checkboxes are measuring the wrong thing. The question is not whether a company filed a TCFD report. The question is whether that report contains enough specificity to change an investment or governance decision. Most do not. Advancing comparability across complex sectors requires moving beyond compliance checklists toward forensic evaluation of what disclosures actually say, and what they conspicuously avoid saying.
— Glen
Lacunaindex sector benchmarks for institutional investors
Institutional investors who need to move beyond framework checklists and into forensic disclosure analysis have a direct path forward with Lacunaindex. The platform applies a consistent, evidence-based methodology to public records across sectors, producing execution scores that measure the gap between corporate narrative and actual delivery.

Lacunaindex sector benchmark reports give investors quantified reference points for evaluating disclosure quality across energy, technology, apparel, pharmaceuticals, and other major sectors. Each report draws exclusively from public filings, earnings calls, proxy statements, and press releases, with no reliance on company-provided data packages. For institutional investors building engagement frameworks or assessing portfolio risk, these benchmarks provide the factual foundation that qualitative impressions cannot.
FAQ
What is disclosure quality benchmarking?
Disclosure quality benchmarking is the systematic comparison of corporate transparency across companies or sectors using quantitative and qualitative metrics derived from recognized frameworks such as TCFD, CDP, CSRD, and IFRS 18. It measures specificity, financial linkage, and assurance depth rather than report volume.
How do disclosure quality standards differ by sector?
Sector-specific materiality drives significant differences. Energy companies face higher assurance expectations and COSO control maturity requirements, while technology and apparel sectors show structurally lower Tier 2 transparency and higher amendment rates among early filers.
What metrics best assess disclosure quality?
The strongest indicators are GHG data collection cycle length, audit non-conformance closure rates, assurance scope, restatement rates, and the degree to which disclosures quantify financial impact rather than describe risk in general terms.
Why does TCFD alignment not guarantee disclosure quality?
TCFD alignment confirms structural compliance with governance and scenario disclosure requirements, but it does not require companies to link scenario outcomes to specific capital expenditure decisions or internal carbon prices. Leading firms conduct multiple quantifications aligned to 1.5°C pathways; laggards rely on vague qualitative references.
How can institutional investors use benchmarking results in engagement?
Investors can reference specific, quantified disclosure gaps in structured engagement letters, requesting that companies provide financial linkages for stated climate targets or improve Tier 2 supplier mapping rates. Factual gap identification produces more productive engagement than general requests for improved transparency.