
An earned reputation score is a forensic metric that assesses whether a company's market valuation is supported by demonstrated delivery, based exclusively on publicly available records including SEC filings, earnings call transcripts, footnotes, proxy statements, and press releases. The score does not rely on management access, proprietary data feeds, or analyst consensus. Every assertion is traceable to a specific filing citation.
Three immediate implications for practitioners:
- Due diligence signal, not confirmation: treat an earned reputation score as a hypothesis-testing input, not a verdict. A high score warrants reduced scrutiny on delivery claims; a low score triggers deeper forensic reads before allocation decisions.
- Governance engagement prioritization: governance teams should rank engagement queues by narrative-vs-delivery gap magnitude. Companies with large gaps and weak audit committee signals warrant escalation ahead of proxy season.
- Journalism and investigative leads: when a company's public narrative diverges materially from its cash flow and balance sheet signatures, that gap is the story. Reporters should probe footnote provisions, receivables aging, and related-party disclosures before filing.
Table of Contents
- How does earned reputation research differ from conventional equity analysis?
- What is the audit-traceable methodology behind an earned reputation score?
- What do the earned, borrowed, and undervalued archetypes mean for decisions?
- How do you interpret execution scores and narrative-vs-delivery gaps?
- How do institutional investors and governance professionals use these scores in practice?
- What are the real limits of earned reputation scoring?
- An audit-traceable walkthrough: from public claim to evidence-linked score
- How do you access Lacunaindex sector benchmarks and forensic reports?
- Key Takeaways
- Why forensic earned-reputation research exposes what conventional analysis misses
- Lacunaindex forensic analytics for institutional due diligence
- Useful sources and primary references
How does earned reputation research differ from conventional equity analysis?
Conventional equity research treats company-reported P&L figures as inputs. Forensic earned-reputation research treats them as falsifiable claims to be cross-checked against cash flow statements, balance sheet dynamics, and footnote disclosures. The distinction is not merely procedural; it changes the evidentiary standard and the questions an analyst asks.
Key methodological contrasts:
- Primary data hierarchy: forensic analysis starts in footnotes and cash flow statements, not the income statement. Reported earnings can be a management construct; cash flow from operations is substantially harder to manipulate and reveals the underlying economics.
- Claim verification vs. acceptance: conventional research asks "what did management report?" Forensic research asks "does the balance sheet corroborate what management reported?"
- Governance signals as leading indicators: weak audit committees, auditor tenure anomalies, pledged promoter equity, and opaque related-party transactions typically precede financial deterioration. Forensic analysis incorporates these as early-warning features alongside arithmetic checks.
- Decision thresholds: forensic outputs set explicit confidence bands before allocation or engagement; conventional research rarely formalizes the evidentiary threshold.
Pro Tip: Adopt an "assume something is wrong" mindset when applying earned-reputation scoring. Markets reward growth narratives, which creates systematic pressure to accept narrative claims uncritically. Starting from skepticism and testing whether footnotes and cash flows corroborate the narrative is the discipline that separates forensic analysis from conventional coverage.
What is the audit-traceable methodology behind an earned reputation score?
The workflow maps each public source to a specific claim category, applies arithmetic cross-checks, and records every assumption explicitly so the output can be reproduced or audited.
| Source | Claim Tested | Primary Check |
|---|---|---|
| 10-K MD&A | Revenue recognition timing and growth trajectory | Cash collected vs. revenue recognized; receivables aging trend |
| Cash flow statement | Operational cash generation vs. reported earnings | Persistent divergence between net income and operating cash flow |
| Balance sheet footnotes | Provisions, contingent liabilities, related-party balances | Year-over-year provision movement vs. disclosed litigation or restructuring |
| Proxy statement | Governance structure, auditor tenure, compensation alignment | Audit committee independence; pay-for-performance linkage |
| Earnings call transcripts | Forward guidance and milestone commitments | Subsequent filing corroboration of stated targets |
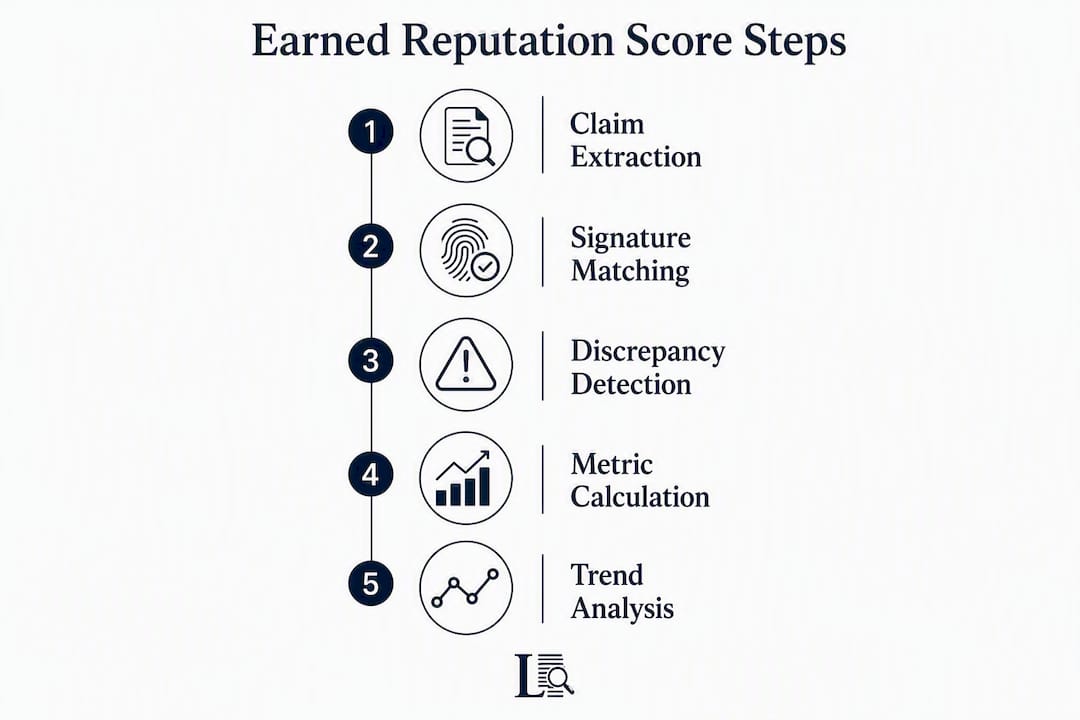
The step-by-step scoring workflow proceeds as follows:
- Extract falsifiable claims from each source category above.
- Formulate testable hypotheses (e.g., "stated margin expansion should appear in gross profit and operating cash flow within two reporting periods").
- Apply arithmetic cross-checks: compare income statement claims against balance sheet and cash flow signatures.
- Record explicit model assumptions, held-constant variables, and sensitivity windows.
- Construct the execution score and narrative-vs-delivery gap from verified and unverified claim counts.
- Link every score node to its source citation and line item for audit traceability.
Pro Tip: Multi-year trend checks are more diagnostic than single-year comparisons. Intra-year peak net debt, provision schedules, and receivable aging across three or more fiscal years expose patterns that a single-period snapshot conceals. Store raw citation offsets so any reviewer can trace a score node back to the exact filing page.
What do the earned, borrowed, and undervalued archetypes mean for decisions?
Archetype classification creates an audit-traceable basis for governance and investment decisions using only public filings. Each archetype carries a distinct evidence profile and maps to different practitioner actions.
| Archetype | Evidence Strength | Governance Signals | Disclosure Red Flags | Investment Posture |
|---|---|---|---|---|
| Earned | High corroboration across sources | Strong audit committee; aligned compensation | Minimal; footnotes consistent with narrative | Hold or add; monitor for narrative drift |
| Borrowed | Low corroboration; narrative exceeds delivery | Passive board; auditor tenure concerns | Receivables growth outpacing revenue; provision reversals | Reduce or hedge; escalate governance engagement |
| Undervalued | Strong delivery evidence; market discount | Often overlooked; governance adequate | Disclosure conservatism; under-communicated milestones | Re-rating candidate; active engagement to surface value |
Action mapping by practitioner type:
- Institutional investors (Earned): maintain position; set a narrative-drift alert for the next two filing cycles.
- Institutional investors (Borrowed): build downside reserves; reconstruct stressed leverage from footnotes before the next earnings event.
- Governance teams (Borrowed): escalate to active engagement; demand audit committee explanation of provision movements and related-party balances.
- Proxy advisors (Borrowed): flag for voting agenda; request auditor independence disclosure and compensation-performance linkage review.
- Journalists (Undervalued or Borrowed): the gap between delivery evidence and market recognition, in either direction, is the investigative lead.
How do you interpret execution scores and narrative-vs-delivery gaps?
The execution score measures the proportion of stated milestones and guidance targets that are subsequently corroborated by filing evidence. The narrative-vs-delivery gap captures both the magnitude and direction of divergence between what management communicated and what the public record confirms.
Confidence band thresholds:
- Green (high corroboration): execution score above the sector benchmark; gap within normal disclosure variance. Supports current allocation thesis; no immediate engagement trigger.
- Yellow (moderate divergence): execution score below sector benchmark or gap widening over two consecutive periods. Warrants a deeper forensic read and governance signal review before the next proxy cycle.
- Red (material divergence): persistent multi-year divergence between reported earnings and operating cash flow, combined with governance anomalies. Treat as a disclosure opacity signal requiring immediate escalation.
Handling borderline scores requires combining metric signals with qualitative governance context. A yellow execution score at a company with a strong, independent audit committee and transparent footnote disclosures carries less weight than the same score at a company with auditor tenure concerns and pledged promoter equity. The indenture mindset borrowed from credit analysis is useful here: map every claim, price the downside first, and keep model assumptions explicit.
How do institutional investors and governance professionals use these scores in practice?
Earned-reputation outputs integrate into existing workflows at four operational points.
Integration checklist:
- Screening: apply sector benchmarks to identify companies with execution scores below the sector median.
- Prioritized forensic read: for flagged companies, pull the full narrative-vs-delivery gap report and review citation-linked evidence.
- Engagement trigger: companies in the red band or with two consecutive yellow periods enter the active engagement queue.
- Portfolio or proxy action: governance teams file engagement letters; investors adjust position sizing or stress-test inputs; journalists develop inquiry scripts from the gap evidence.
Governance teams and journalists should raise the following evidence demands when a large narrative gap is identified:
- Request a reconciliation of receivables aging against revenue recognition policy disclosures.
- Demand an explanation of provision reversals that coincide with earnings beats.
- Ask for auditor attestation on related-party transaction terms and arm's-length pricing.
- Cross-reference public disclosures with investigative reporting to validate or challenge the narrative independently.
For valuation work, a borrowed-archetype classification supports a downward adjustment to the terminal growth assumption. For proxy filings, a red-band execution score provides documented grounds for a withhold recommendation on audit committee members.
What are the real limits of earned reputation scoring?
The methodology depends entirely on the completeness and accuracy of public records. Four structural constraints apply:
- Filing latency: SEC filing cycles mean scores reflect information that may be three to twelve months old. Rapidly deteriorating situations can move faster than the public record updates.
- Legitimate cash-consuming models: early-stage or capital-intensive businesses may show persistent earnings-to-cash-flow divergence for disclosed, non-manipulative reasons. The score must be read against sector norms, not absolute thresholds.
- Industry data idiosyncrasies: revenue recognition practices, working-capital cycles, and provision norms vary materially by sector. Applying a cross-sector threshold without adjustment produces false positives.
- Scope of falsifiable claims: the score measures what is disclosed. Undisclosed arrangements, verbal commitments, and off-balance-sheet structures that are not required to be filed fall outside the methodology's reach.
Common misuses to avoid:
- Over-relying on a single score for exclusionary policy without reviewing the underlying citation evidence.
- Misreading a temporary operational shock (supply chain disruption, one-time restructuring) as chronic narrative failure.
- Conflating governance signals with execution metrics; a weak board does not automatically mean earnings manipulation.
Pro Tip: For every score, construct a short counterfactual: what evidence, in the next filing cycle, would reverse the classification? Document it before the filing arrives. This discipline prevents anchoring bias and keeps the analysis genuinely falsifiable.
An audit-traceable walkthrough: from public claim to evidence-linked score
The following anonymized example illustrates the end-to-end process. A manufacturing company stated in its 10-K MD&A that volume growth of 12% and margin expansion of 150 basis points were achieved in the prior fiscal year.

Step 1 — Claim extraction: the stated claims are (a) 12% volume growth and (b) 150 bps margin expansion.
Step 2 — Expected signatures: if both claims are accurate, operating cash flow should grow proportionally, receivables should not outpace revenue, and gross margin should be visible in the income statement and corroborated by segment disclosures.
Step 3 — Observed discrepancies: the cash flow statement shows operating cash flow flat year-over-year. Receivables grew 22% against 12% revenue growth. Gross margin in the segment footnote shows 80 bps expansion, not 150 bps.
Step 4 — Metric calculation: the execution score for this claim set is 1 of 3 corroborated (volume growth partially supported; margin and cash flow diverge). The narrative-vs-delivery gap is classified as material.
| Source | Line Item Tested | Observed vs. Claimed | Score Node |
|---|---|---|---|
| 10-K Income Statement | Gross margin, segment footnote | 80 bps vs. 150 bps claimed | Not corroborated |
| Cash Flow Statement | Operating cash flow YoY | Flat vs. proportional growth expected | Not corroborated |
| Balance Sheet | Receivables vs. revenue growth | +22% vs. +12% revenue | Red flag |
Audit-trail checklist for verifying this example:
- Locate the 10-K filing on EDGAR using the company's CIK number.
- Pull the MD&A section and record the exact volume and margin claims with page references.
- Extract operating cash flow from the Statement of Cash Flows and compare to prior-year figure.
- Pull the segment footnote and verify gross margin by segment.
- Record all citation offsets (filing date, page, line item) before constructing the score node.
How do you access Lacunaindex sector benchmarks and forensic reports?
Lacunaindex publishes free sector benchmarks as public valuation references. These benchmarks include sector-median execution scores, narrative-vs-delivery gap distributions, and archetype prevalence by industry. No subscription is required to access them.
Gated outputs available to subscribers include:
- Full company forensic reports with citation-linked evidence, execution scores, and archetype classification.
- Narrative-vs-delivery gap time series across multiple filing cycles.
- Governance signal overlays drawn from proxy statements and auditor disclosures.
- Sector comparison tables positioning a specific company against its peer group.
Scores are refreshed following each major filing event, including 10-K and 10-Q releases and material 8-K disclosures. The cadence means most company scores update quarterly, with interim refreshes triggered by material public statements or earnings calls.
To request a demo or institutional trial, prepare the following before contacting Lacunaindex:
- A list of target companies or sectors for initial coverage.
- A description of the workflow where forensic scores will be integrated (due diligence, proxy voting, investigative research).
- Any existing scoring or governance frameworks the team uses, so onboarding can map Lacunaindex outputs to current processes.
Key Takeaways
Earned reputation scoring is the only audit-traceable forensic metric that classifies corporate valuation support using exclusively public records, making every score reproducible and citation-linked.
| Point | Details |
|---|---|
| Definition | Earned reputation is a forensic score quantifying whether market valuation is supported by delivery in public records. |
| Primary use | Institutional investors, governance teams, and proxy advisors use scores to prioritize engagement and adjust allocation. |
| Core caution | Filing latency and sector idiosyncrasies require scores to be read against benchmarks, not absolute thresholds. |
| Audit traceability | Every score node links to a specific filing citation, line item, and arithmetic check for full reproducibility. |
| Lacunaindex access | Free sector benchmarks are publicly available; full company forensic reports require a subscription. |
Why forensic earned-reputation research exposes what conventional analysis misses
The most consequential risks in public company analysis rarely appear in the income statement. They accumulate in footnotes, provision schedules, and the gap between what management says on an earnings call and what the cash flow statement records three months later. Conventional coverage, structured around reported figures and management guidance, is architecturally unable to surface those risks systematically. Forensic earned-reputation research is not a supplement to that coverage; it operates from a different evidentiary premise entirely. The question is never "what did management report?" but "what does the public record corroborate?" That shift in framing changes which companies look safe, which look overvalued, and which are quietly delivering more than the market recognizes. Lacunaindex's audit-traceable methodology applies that discipline consistently, at scale, across sectors, using only what is already publicly filed.
Lacunaindex forensic analytics for institutional due diligence
Institutional investors and governance professionals who need audit-traceable earned-reputation scores can access Lacunaindex's free sector benchmarks immediately, with no registration required. The benchmarks provide sector-median execution scores and archetype distributions as a starting point for screening and engagement prioritization.

Full company forensic reports, including citation-linked narrative-vs-delivery gap analysis, governance signal overlays, and multi-cycle execution score time series, are available through a subscription. Institutional access tiers are structured for research teams, governance advocates, and proxy advisory firms, with enterprise onboarding that maps Lacunaindex outputs to existing due diligence and voting workflows. To request a demo, contact Lacunaindex directly with your target coverage list and workflow context.
This article provides general informational content about forensic analytics methodology. It does not constitute investment, legal, or governance advice. Readers should verify current filing data through primary sources and consult qualified professionals before making allocation or governance decisions.
Useful sources and primary references
- SEC EDGAR full-text search — search 10-K, 10-Q, 8-K, and proxy (DEF 14A) filings by company CIK or keyword
- Annual Report Discrepancy in Equity Research: A Forensic Guide — Lacunaindex's documented methodology for detecting discrepancies between reported and actual performance
- Forensic Financial Analysis Methodology Steps: 2026 Guide — step-by-step scoring workflow for reproducible earned-reputation analysis
- Governance Advocate Forensic Research Advantages: 2026 Guide — specific applications for governance professionals and proxy advisors
- Public Disclosures and Investigative Reporting: A Forensic View — pairing public filings with investigative techniques to validate or challenge narratives
- Lacunaindex sector benchmarks — free public valuation references by sector, including execution score distributions and archetype prevalence
Suggested EDGAR search queries for reproducing example checks: