
A company's capital allocation track record is best judged by one question: does incremental ROIC persistently clear WACC across a five to ten year window? Persistent excess spread signals value creation; persistent shortfall signals destruction, regardless of what management narrates. The five levers to check are reinvestment, M&A, debt management, buybacks, and dividends. The first three diagnostics are the ROIC trend line, buyback timing against the price chart, and the frequency of goodwill impairments.
TL;DR:
- Companies must consistently generate ROIC above WACC over five to ten years to truly create value, with shortfalls indicating destruction.
- M&A deal quality should be evaluated through acquisition premiums, synergy realizations, and impairment history, especially when repeated deals lack operational fit.
- The most reliable measure of capital allocation skill compares incremental ROIC with WACC sensitivity bands to identify structural advantages or cyclical dependence.
- Management communication, incentive structures, and governance flags provide critical qualitative signals to distinguish skilled allocators from those pursuing short-term gains.
- A formal scoring rubric combining quantitative metrics and qualitative indicators helps objectively assess a company's track record in capital allocation.
Table of Contents
- The Five Pillars of a Capital Allocation Track Record
- How Do You Measure ROIC Against WACC Correctly?
- What Qualitative Signals Separate Skilled Allocators From Lucky Ones?
- A Practical Grading Checklist for Scoring the Track Record
- How Forensic Disclosure Analytics Verify the Numbers
- What Analysts Get Wrong About Capital Allocation Scores
- Where to Verify These Numbers and Methods
- Sources
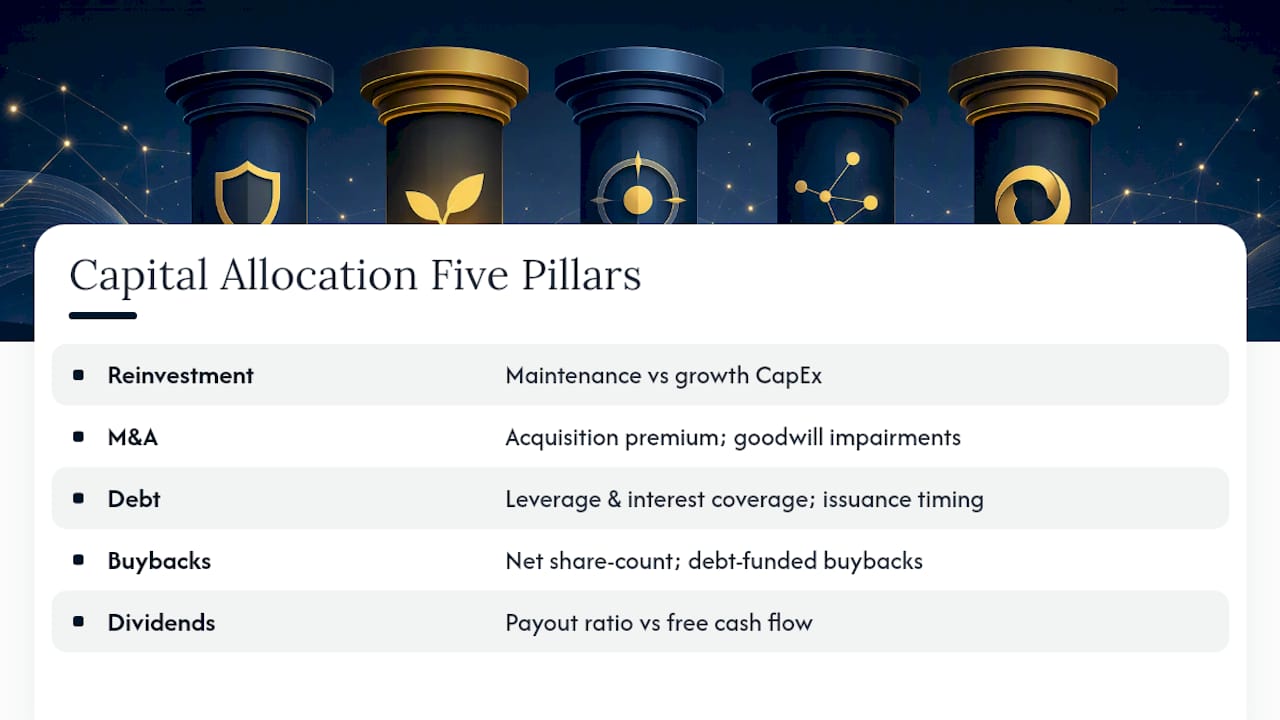
The Five Pillars of a Capital Allocation Track Record
Judging a capital allocation track record requires pulling consistent line items across five distinct levers, because each one carries a different failure mode and a different set of filing sources to mine.
Reinvestment deserves the first look, since it is usually the largest cash outlay. Split capital expenditure into maintenance versus growth using the segment disclosures and MD&A commentary in the 10-K, and treat research and development consistently across peers rather than expensing it in one model and capitalizing it in another. Where a company breaks out major projects (a new plant, a platform build), compute incremental ROIC on that specific investment rather than relying on the blended company-wide figure.
M&A is where capital allocation track records go to die. Measure the acquisition premium paid over unaffected market value, track the subsequent goodwill impairment history in the notes to the financial statements, and compare realized synergies against the synergy figures management projected at deal announcement. A pattern of repeat, similarly structured deals from the same management team, especially in adjacent categories with no operational fit, deserves particular scrutiny.
Debt management ties directly into the other four levers. Track leverage ratios and interest coverage over the period, and note the timing of debt issuance and repayment relative to rate cycles. A useful cross check: did the company issue debt specifically to fund buybacks near a cyclical high? That link between financing decisions and shareholder distributions often exposes short-term thinking dressed up as capital discipline.
Share repurchases need both a gross and a net view, since gross buyback dollars mean little if stock-based compensation issuance offsets most of the reduction. Calculate net share count change year over year, flag any buybacks funded by new debt issuance rather than free cash flow, and overlay repurchase volume against the long-term price chart to see whether the company bought aggressively into strength or discipline into weakness.
Dividends round out the picture. Compare the payout ratio against free cash flow rather than reported earnings, since earnings can be managed in ways free cash flow resists. Special dividends and sudden payout cuts both carry signal value about sustainability, and a rising payout ratio against flat or declining free cash flow is an early warning most analysts catch too late.
How Do You Measure ROIC Against WACC Correctly?
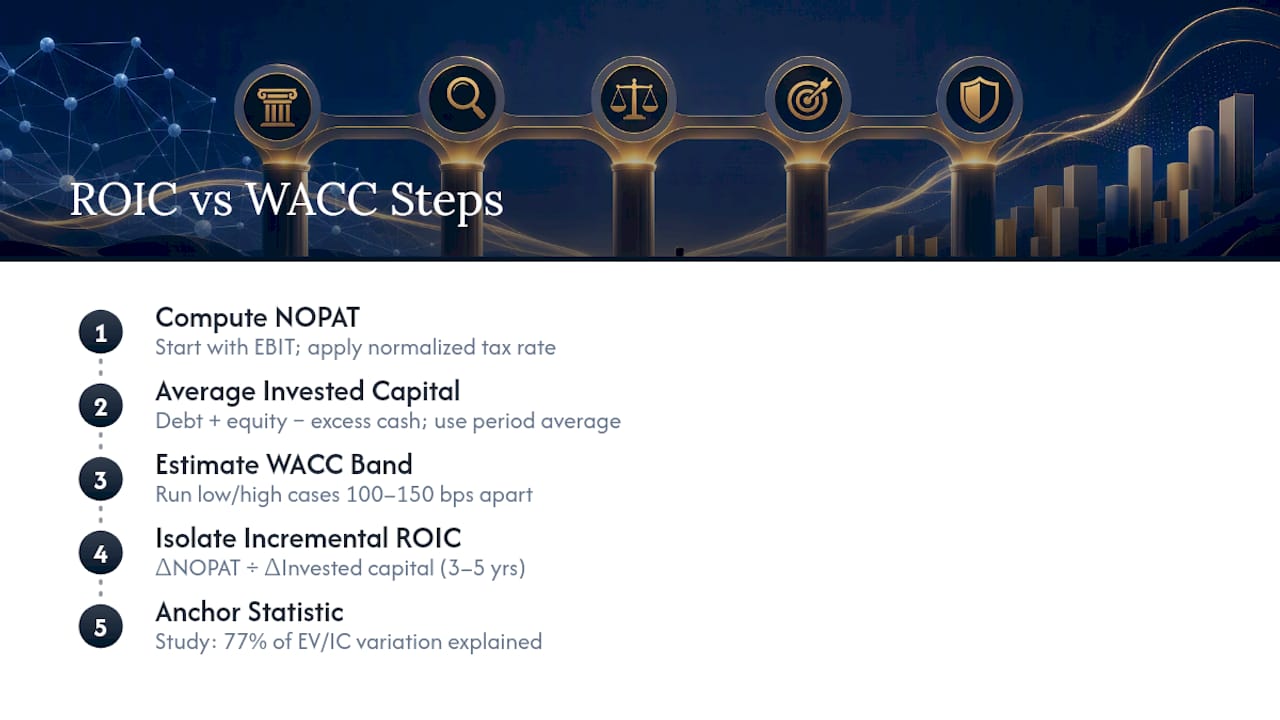
The central quantitative test for capital allocation effectiveness compares Return on Invested Capital against Weighted Average Cost of Capital, and the spread between the two, sustained over time, is the single number that separates value creators from value destroyers.
Step 1: Compute NOPAT. Start with operating income (EBIT) from the income statement, then apply a normalized tax rate rather than the reported effective rate, which swings year to year on one-time items. Add back any unusual restructuring charges only if they are genuinely non-recurring and disclosed as such in the filing footnotes.
Step 2: Compute average invested capital. Add total debt and equity, subtract excess cash and non-operating investments, and average the beginning and ending balance for the period rather than using a single point-in-time figure. This step is where most spreadsheet models go wrong, since a company sitting on a large cash balance from a recent bond issuance will show artificially depressed ROIC if the cash isn't excluded.
Step 3: Estimate WACC with a sensitivity band, not a point estimate. Rather than committing to one WACC number, run a high and low case, typically 100 to 150 basis points apart, using a reasonable equity risk premium range and the company's actual cost of debt from its most recent issuance. If ROIC clears even the high end of the WACC band across multiple years, the case for skilled allocation gets much stronger.
Step 4: Isolate incremental ROIC. Analysts should prioritize incremental ROIC over long-term average ROIC, because incremental ROIC measures the return on the most recent dollar invested rather than smoothing over a decade of decisions, some skillful and some not. Calculate it as the change in NOPAT divided by the change in invested capital between two periods, ideally three to five years apart to smooth out noise from single-year anomalies.
Statistic to anchor the analysis: a study combining return on capital, expected steady-state revenue growth, and cost of capital explains roughly 77% of the variation in enterprise value to invested capital ratios across a cross-sectional bank and consulting sample. That figure matters because it confirms ROIC and WACC aren't just accounting abstractions. They are the inputs the market actually prices.
When reading the trend line across five to ten years, three patterns matter more than the average itself. A persistent, stable spread above WACC suggests a repeatable process rather than a lucky cycle. High volatility in the spread, even if the average looks fine, suggests the company is riding commodity or macro cycles rather than generating structural advantage. And a recent inflection, where incremental ROIC has fallen below the trailing average, often signals that new investment is being made into a maturing or saturated opportunity set even while the long-term average still looks respectable.
Three data caveats deserve attention before trusting any of these numbers. Excess cash must be stripped from invested capital, or ROIC understates true capital efficiency. Capitalized intangibles from acquisitions inflate the invested capital base without necessarily reflecting the operating investment management actually controls, so some analysts model a version with and without acquired intangibles. Finally, normalize share count for buybacks and issuance so that per-share metrics aren't quietly flattered by financial engineering rather than operating performance.
What Qualitative Signals Separate Skilled Allocators From Lucky Ones?
Numbers alone will not catch every capital allocation failure, because a single well-timed year can flatter a mediocre long-term process. Reading the qualitative record, management communication, incentive design, and governance structure, closes that gap.
Start with how management talks about capital decisions across multiple years of letters, investor presentations, and earnings call transcripts. Consistency matters more than eloquence: a management team that explains its capital allocation priorities the same way in 2019 and 2026, and whose stated plans line up with what actually happened, is behaving differently from one that reinvents its framework every time the last one produced a disappointing outcome.
Incentive structure is the next check, and it is often buried three sections deep in the proxy statement. Compensation tied primarily to short-term EPS growth or revenue targets creates a direct incentive to pursue debt-funded buybacks or dilutive acquisitions that flatter next quarter's numbers, regardless of the ten-year ROIC impact. Compensation tied to return on invested capital, or to multi-year total shareholder return with a long vesting schedule, aligns management's personal incentive with the same test an analyst is running externally.
Several red flags recur across capital allocation track records that later collapsed:
- Serial, debt-fueled acquisitions with no clear synergy realization and rising goodwill relative to tangible assets.
- Buyback volume that spikes at or near multi-year price highs, then dries up during subsequent price declines.
- Repeated restatements, late filings, or recurring "material weakness" language in auditor communications.
- Related-party transactions disclosed in the proxy that route capital toward insiders or affiliated entities rather than operations.
- Shareholder votes on compensation or capital plans that pass narrowly year after year despite proxy advisor opposition.
Governance indicators worth a direct proxy read include the presence or absence of clawback policies for executive compensation tied to later-restated results, and whether the board includes directors with genuine capital markets or operating experience relevant to the company's specific capital intensity.
Pro Tip: Cross-reference the compensation committee's stated performance metrics against the actual capital allocation decisions made that year. If the metric is EPS growth and the year featured a large debt-funded buyback, you have found the incentive that produced the decision, not a coincidence.
A Practical Grading Checklist for Scoring the Track Record
A reproducible rubric turns capital allocation analysis from an impression into a comparable score, and it works best as a spreadsheet with explicit weights rather than a narrative judgment call.
- Assign bucket weights. A workable split allocates 60% of the score to quantitative metrics (ROIC versus WACC spread, incremental ROIC, buyback accretion, debt trend) and 40% to qualitative factors (communication consistency, incentive alignment, governance flags). Adjust the split toward qualitative weight for companies where recent M&A activity makes the numbers noisy.
- Score each bucket on a 0 to 100 scale, then map the blended total to letter grades: 85 and above earns an A (clear value creator), 70 to 84 a B, 55 to 69 a C (mixed record, proceed with caution), and below 55 a D or F depending on the severity of red flags identified in the qualitative review.
- Apply a recency bias to the time window. Weight the most recent three years at roughly 60% of the quantitative score and the remaining years at 40%, since capital deployment patterns have shifted meaningfully across sectors, and a management team from a decade ago may no longer be the one making decisions today.
- Build the spreadsheet with these columns at minimum: fiscal year, NOPAT, average invested capital, ROIC, WACC (low/high), spread, incremental ROIC, gross buyback dollars, net share count change, dividend payout ratio versus FCF, debt issuance tied to buybacks (yes/no), and a governance flag count pulled from the proxy review.
- Translate the score into an action. A grade below 55 with recent deterioration warrants a downgrade or exclusion; a C-range score with improving qualitative signals earns a watchlist placement pending the next reporting cycle; an A or B with a persistent spread supports a hold or buy thesis on capital allocation grounds alone, separate from the valuation call.
- Know where the mechanical score breaks down. A single clean acquisition can flatter a five-year average even when the broader pattern is undisciplined, and a sector facing a temporary demand collapse can depress ROIC without reflecting a genuine allocation failure. Escalate to a full forensic review, examining transcripts, restated filings, and segment-level detail, whenever the score sits within ten points of a grade boundary.
Sector context changes what "good" looks like on this rubric. Capital-intensive industries such as utilities or telecommunications routinely run ROIC close to WACC by regulatory design, while asset-light software businesses should show a wide and durable spread if their allocation is genuinely skilled rather than just structurally advantaged.
How Forensic Disclosure Analytics Verify the Numbers
Every metric in the grading rubric above depends on management's own disclosures being accurate and complete, which is precisely the assumption forensic disclosure analysis exists to test rather than take on faith.
The raw material comes from four sources: the MD&A section of the 10-K filed on SEC EDGAR, earnings call transcripts, proxy statements, and press releases announcing deals or buyback authorizations. The goal is extracting specific, checkable claims, a projected synergy figure, a stated payback period on a capital project, a promised buyback pace, and then tracking whether the subsequent filing confirms or contradicts that claim.
Three signal types tend to separate credible allocators from narrative-driven ones: disclosure inconsistency between what a management letter promises and what a later 10-K reports, the frequency of goodwill impairment or restructuring charges tied to prior deals, and the gap between announced buyback authorizations and shares actually repurchased in the following quarters. A methodology can classify companies into archetypes based on how these signals resolve against valuation: those whose delivery matches or exceeds their narrative, those whose current price reflects promises not yet confirmed by disclosed outcomes, and those whose delivery quietly exceeds a narrative the market has discounted.
A pattern of divergence between the language used in investor presentations and earnings calls and the outcomes later recorded in SEC filings and impairment entries is one of the strongest available signals of governance risk, precisely because it is drawn entirely from what the company itself chose to disclose.
An analyst without subscription access can still run a simplified version of this workflow manually: extract a specific forward claim from an earnings call transcript, locate the confirmable outcome in the next one to three filings, and adjust the qualitative score in the grading rubric up or down based on whether the claim held. Lacunaindex's guide to reading a forensic report walks through how that same claim-to-outcome logic scales across a full disclosure history rather than a single quarter.
What Analysts Get Wrong About Capital Allocation Scores
The most common mistake is mistaking EPS growth for value creation. A buyback that shrinks the share count while return on invested capital deteriorates is financial engineering, not capital discipline, no matter how the earnings-per-share trend looks on a slide.
The second mistake is ignoring price discipline entirely. As the UBS framework puts it, what is smart at one price is dumb at another, and that applies equally to buybacks, acquisitions, and dividend increases. The third is averaging ten years of decisions into one ROIC figure and missing that the most recent three years, where incremental ROIC actually lives, tell a different story.
The fix is procedural: document every assumption in the spreadsheet, save the source filings you pulled each figure from, and keep the grading sheet reproducible enough that another analyst could rerun it. Mechanical scoring paired with disclosure-based verification catches far more than either approach run alone.
— Glen
Where to Verify These Numbers and Methods
Start with SEC EDGAR for the underlying filings behind every metric in this framework. Bank and consulting research, including the UBS capital allocation framework and BCG's analysis of top allocators, supplies benchmark methods and empirical patterns. Wall Street Prep's capital allocation guide offers worked ROIC formulas for the spreadsheet build, and Lacunaindex's sector benchmarks provide a public reference point for comparing your scored results against peer valuation and execution data.
This article is general information, not a substitute for advice from a qualified financial advisor. Consult a qualified financial professional about your own circumstances before acting on anything here.
Sources
- Capital allocation | UBS Global
- How to Analyze a Company's Capital Allocation: A Complete Framework
- How the Best Companies Allocate Capital in 2026 | BCG
- Capital allocation (Morgan Stanley research)
- Capital Allocation – Wall Street Prep