
The most reliable proof of buyback follow through is not the authorization amount a board announces. It is the net change in diluted shares outstanding, verified against SEC filings, over the periods a company had cash to spend. Authorization language signals intent; only realized net share retirement, cross-checked against 10-Q and 10-K cash-flow statements, proves execution. Anything short of that comparison is narrative, not evidence.
TL;DR:
- Net buyback yield is the clearest measure of actual share retirement, calculated by comparing diluted shares outstanding at the start and end of a period.
- Cash spent on repurchases should be verified against cash-flow statements, and share count changes cross-checked to detect masking activities like employee grants or conversions.
- Verification requires examining multiple quarterly filings to identify patterns of flat net share counts despite reported buyback spending.
- Governance disclosures should include cumulative net share retirement against a clear, time-limited authorization window to improve transparency and accountability.
- Market conditions and sector differences significantly influence buyback execution rates, with energy and industrials tending to pause more during downturns, unlike tech and finance firms.
Table of Contents
- What Is Buyback Follow Through and Why the Net Buyback Yield Matters Most
- Where the Evidence Actually Lives in Public Filings
- A Five-Step Workflow to Audit Any Buyback Program
- Governance Red Flags That Predict Non-Execution
- How Lacuna Index Turns Filings Into an Execution Score
- Announced Versus Executed: What Changes by Sector and Market Condition
- Quantitative Models for Scoring Execution Effectiveness
- How Investors React to Partial or Delayed Buybacks
- What Governance Teams and Investors Should Demand Next
- See Your Sector's Real Execution Rate With Lacuna Index
- Sources
What Is Buyback Follow Through and Why the Net Buyback Yield Matters Most
Four metrics separate a real buyback program from a headline. Each one answers a different question about whether cash left the company and shares actually disappeared.
Net buyback yield is the calculation to lead with. Take diluted shares outstanding at the start of the measurement period, subtract diluted shares outstanding at the end, divide by the starting count. A positive number means real share retirement happened. Repurchase trackers that net share-count changes against new issuance report this as the clearest available signal of what shareholders actually received, because gross repurchase dollars can be fully offset by continuous stock-based compensation grants.
Cash spent versus authorization size comes next. Pull the "repurchases of common stock" line from the financing section of the cash-flow statement and compare it to the dollar figure or share count the board authorized.
Share-count netting catches the trap most casual readers miss:
- Gross buybacks can look aggressive while net shares outstanding barely move.
- RSU vesting and option exercises quietly reissue shares the company just retired.
- Convertible note settlements and M&A stock issuance do the same thing at larger scale.
Market concentration is the context check. Aggregate S&P 500 repurchases posted a 6.2% gain to $249.0 billion in the third quarter of 2025 after a steep decline the prior quarter, and that spending concentrates heavily among a handful of mega-cap names. A company's execution rate means little without that peer backdrop.
Where the Evidence Actually Lives in Public Filings
Verification is a document-hunting exercise, and the documents are specific.
- Cash flow statement, financing activities. Look for "repurchases of common stock" or "treasury stock acquired." This is the cash actually spent, reported quarterly in the 10-Q and annually in the 10-K.
- Cover-page share count. Every 10-Q and 10-K cover page states diluted shares outstanding as of a filing date. This figure is the referee: it cannot be spun, and it reflects every issuance and retirement netted together.
- Treasury stock movement on the balance sheet. A rising treasury stock balance corroborates cash-flow repurchases; a flat balance despite reported spending is a mismatch worth investigating.
- Proxy statement authorization language. Proxies and 8-K disclosures state the board's approved dollar amount or share count, the approval date, and, when present, an expiration window.
- Earnings-call commentary and press releases. Management often frames buyback pace verbally in ways that outrun the cash-flow evidence; treat these as claims to test, not facts to record.
The practical workaround for netting issues is comparing cover-page diluted share counts across at least four consecutive quarters rather than trusting a single period. A company can report a large repurchase in one quarter's cash-flow statement while the diluted share count barely budges because equity compensation grants landed in the same window. Cross-referencing public disclosure gaps against multiple filing periods is the only way to catch that pattern reliably. Third-party repurchase indices and trackers add a useful sanity check against the company's own disclosures, particularly when a filing is ambiguous about timing.
A Five-Step Workflow to Audit Any Buyback Program
Building a defensible verdict on follow through takes five sequential steps, and skipping any one of them weakens the conclusion.
- Gather. Collect the original announcement or 8-K, the proxy statement or board resolution authorizing the program, every 10-Q and 10-K filed since, related press releases, and a quarter-by-quarter diluted share count history going back at least two years.
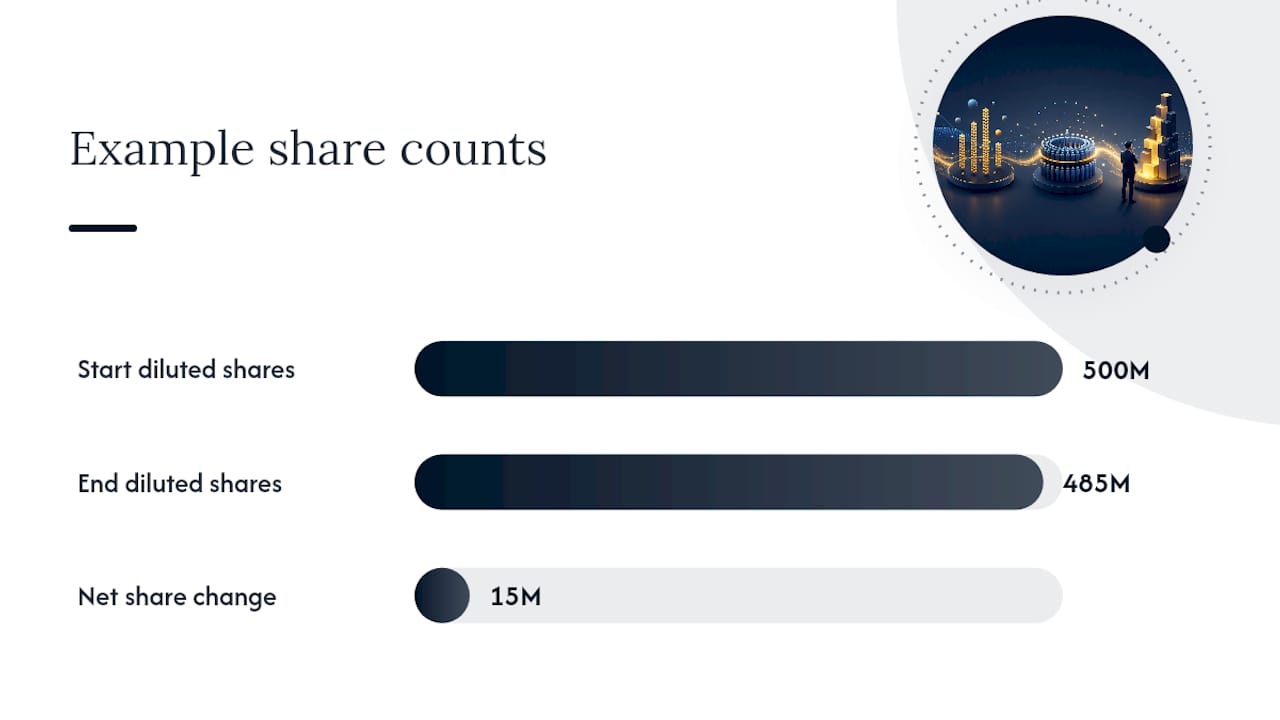
- Compute. Calculate cash repurchases from the financing section of each cash-flow statement, then calculate net share change using split-adjusted diluted shares outstanding. The formula: Net Buyback Yield = (Diluted Shares[start] − Diluted Shares[end]) ÷ Diluted Shares[start]. A company with 500 million diluted shares at the start of the year and 485 million at year-end delivered a 3% net buyback yield, regardless of how much gross cash it spent getting there.
- Adjust. Subtract the dilutive effect of RSU vesting, option exercises, and any shares issued for acquisitions or convertible note settlements. This isolates the portion of the net change attributable to open-market or accelerated share repurchase (ASR) activity, rather than to unrelated corporate actions.
- Compare. Set authorization size against cash actually spent, then set both against the net share change. Benchmark the resulting execution rate against sector peers or the S&P aggregate; a company running at 20% of the sector's typical execution pace is a different story than one running at 90%.
- Conclude. Write a one-paragraph verdict and attach a short evidence table listing authorization amount, cash spent, net share change, and a graded outcome.
- Deliverable: a verdict of "Follow-through: High," "Partial," or "None," backed by the table, not asserted on its own.
Pro Tip: Run the net buyback yield calculation on a trailing twelve-month basis, not a single quarter. Repurchase timing is lumpy, and ASR contracts in particular can create one large quarter followed by several quiet ones that look like abandonment but are not.
Accelerated share repurchase contracts deserve a specific note in step one. An ASR settles through an investment bank intermediary and can retire shares immediately upon initial delivery, with a final settlement adjustment later. A cash-flow read alone can miss this timing; the footnotes and interim share-count disclosures carry the real story.
Governance Red Flags That Predict Non-Execution
Some patterns show up in the filings well before a program quietly lapses.
- Flat or rising net share counts across multiple quarters despite an active authorization is the single clearest warning sign. Cash may be flowing out the door while equity compensation quietly replaces every share retired.
- Open-ended authorization language in the proxy, with no expiration date and no per-period spending guidance, gives management maximum discretion to do nothing without technically breaking a promise.
- Heavy offsetting issuance from convertible notes or large equity grants can mask a program that is real on paper and negligible in net effect; the diluted share trend exposes this faster than the cash-flow line does.
- Concurrent insider selling alongside a newly announced authorization is worth cross-referencing against Rule 10b5-1 trading plan disclosures, since a scheduled sale reads very differently than an opportunistic one.
- Sudden capital preservation moves, such as a new debt draw or covenant renegotiation shortly after a buyback announcement, often precede quiet abandonment of the program.
Sophisticated investors generally read an incomplete program as a negative signal, and research on this behavior finds it is rarely explained by short-term cash-flow shortages. In one large sample covering 1985 through 2012, 40% of announcing firms repurchased no shares in the announcement quarter, and 24% repurchased none in the full announcement year, even though the average announcement carried a roughly 2.5% abnormal stock return.
How Lacuna Index Turns Filings Into an Execution Score
Lacuna Index builds its execution scores directly from the documents listed above: earnings-call transcripts, 10-Q and 10-K filings, proxy statements, and press releases, mined systematically rather than sampled selectively. The output is a structured comparison between what management claimed and what the share count and cash-flow statement actually show.
A reproducible evidence table follows this layout:
Sector context changes what that "Partial" verdict means. Lacuna's sector benchmarks exist specifically to draw that distinction, and case analyses like the one comparing Broadridge and GM's capital allocation choices walk through this exact table structure against real disclosures.
Pro Tip: When a company's execution score sits well below its sector benchmark, check the proxy for authorization expiration language before assuming bad faith. A program with eighteen months left on the clock is a different case than one quietly running past its stated window.
Announced Versus Executed: What Changes by Sector and Market Condition
Execution rates are not static across sectors, and treating a single benchmark as universal produces bad conclusions. Capital-intensive sectors like energy and industrials tend to pause repurchases fastest when commodity prices or order books weaken, because their boards treat buybacks as the most discretionary line in the capital budget. Technology and financial firms, by contrast, often maintain buyback pace even through modest earnings softness, using repurchases to offset heavy stock-based compensation dilution rather than to signal confidence.
Market conditions matter as much as sector. Aggregate buyback spending fell sharply in the second quarter of 2025 amid macro uncertainty before recovering with a 6.2% gain in the third quarter, a pattern consistent with buybacks functioning as the flexible spending category boards cut first and restore once visibility returns. That volatility means a single-quarter execution snapshot taken during a downturn will understate a company's typical follow-through, while one taken during a recovery quarter can overstate it.
The practical fix is a rolling comparison: measure announced-versus-executed spending on a trailing four-quarter basis and note where that window falls relative to the broader market cycle. A company that paused buybacks in a quarter when the entire S&P 500 pulled back 20% is behaving like its peers. A company that paused while sector peers kept spending is sending a different signal entirely, one that belongs in the red-flag column rather than the macro-timing column.
Quantitative Models for Scoring Execution Effectiveness
Beyond the core net buyback yield calculation, a handful of statistical approaches sharpen the picture. A rolling execution ratio, cash actually spent divided by cash authorized for the trailing twelve months, smooths out the lumpiness that comes from ASR settlement timing and quarter-end authorization renewals. A dilution-adjusted retirement rate takes the raw net buyback yield and strips out the portion attributable to equity compensation issuance, isolating the share retirement that management's discretionary spending actually caused.
Regression-based approaches are gaining traction among institutional research desks: modeling net buyback yield against free cash flow, leverage ratios, and insider transaction activity can flag statistical outliers, companies whose execution rate is inconsistent with their balance sheet capacity in either direction. A firm with ample free cash flow and low leverage that still posts a near-zero net buyback yield is a stronger anomaly than a highly leveraged firm doing the same thing, because the cash-constrained explanation does not hold.
None of these models replace the document-level verification described earlier. They function as screening tools to prioritize which companies deserve a full forensic read of their 10-Q and 10-K filings, not as substitutes for reading them.
How Investors React to Partial or Delayed Buybacks
Markets do not treat every incomplete buyback the same way, and the distinction hinges on whether investors believe the shortfall reflects discipline or evasion. A company that pauses repurchases while explicitly redirecting cash toward a announced acquisition or debt reduction plan tends to draw muted reaction, because the capital allocation logic is visible and testable against subsequent filings.
A company that authorizes a large program, generates an announcement-day price pop, and then quietly lets net share counts drift flat for several quarters faces a different reception once sophisticated investors catch the pattern. That gap between initial abnormal announcement return and delivered execution is precisely the mispricing window forensic analysis exists to close, and institutional holders increasingly build watchlist triggers around exactly this discrepancy rather than waiting for a company to explain itself on an earnings call.
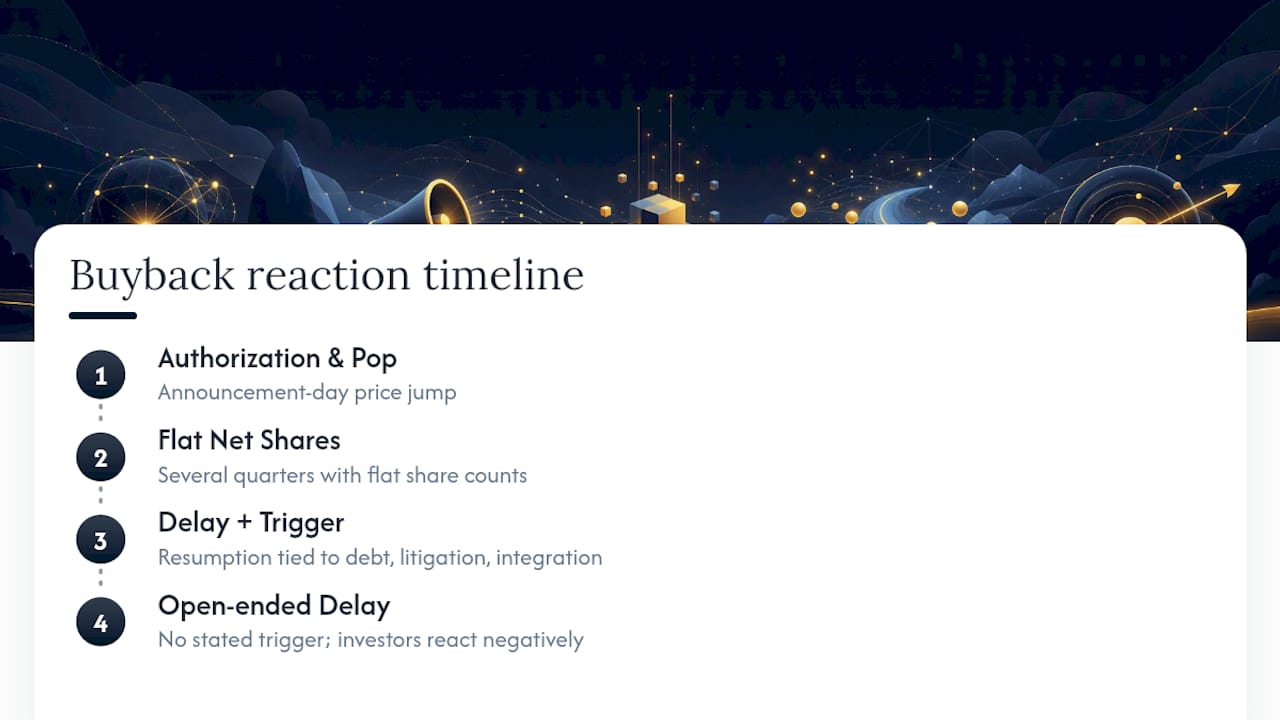
Delayed buybacks, as opposed to abandoned ones, generally get more patience if the company communicates a specific resumption timeline tied to a measurable event, a debt covenant clearing, a pending litigation resolution, a completed integration. Open-ended delay without a stated trigger reads as the weaker signal, and it is the pattern most consistent with the negative reception incomplete programs tend to receive from experienced capital allocators watching the filings rather than the press release.
What Governance Teams and Investors Should Demand Next
Boards should be reporting cumulative net share retirement against a time-limited authorization window in every proxy filing, not leaving investors to reconstruct it from scattered cash-flow lines. That single disclosure change would close most of the gap between board promises and delivery this analysis exists to expose.
Engagement teams should fold execution scores directly into voting decisions and watchlist criteria, treating a persistently low net buyback yield the same way they already treat weak say-on-pay outcomes. The one policy ask worth pushing hardest: no open-ended authorizations. Every program should carry a stated expiration and a required cumulative-spend disclosure against it.
— Glen
See Your Sector's Real Execution Rate With Lacuna Index
Lacuna Index gives you the forensic infrastructure this analysis requires without forcing you to manually reconcile cash-flow statements against cover-page share counts every quarter. Every execution score on the platform is built from the same public filings covered above, structured into audit-traceable reports so you can see exactly which disclosure produced which number.

Sector benchmarks are free to view and let you check whether a company's execution rate looks disciplined or disconnected relative to its peers before you commit analyst time to a deeper read. For a fuller transparency check on portfolio holdings generally, the cost-control checklist from Marmot Finance pairs well with execution-score screening. Start by reviewing the sector benchmarks for the names on your watchlist, then request access to full company-level forensic reports to see the evidence table behind any score that surprises you.
Sources
- Why Do Some Firms Announce Stock Buybacks But Not Follow Through? | SMU Cox School of Business
- Better things to do or doing nothing at all? – the implications of incomplete share repurchase programs
- Thetrading
- S&P 500 Q3 2025 buybacks post modest 6.2% gain to $249.0 billion