
Book-to-bill analysis divides new orders received (bookings) by revenue recognized (billings) over the same period. A ratio above 1.0 means orders are outpacing recognized revenue, a leading signal of backlog growth and rising near-term demand. A ratio below 1.0 signals the opposite: the business is billing faster than it is booking, which erodes backlog and often precedes a revenue slowdown.
TL;DR:
- A sustained book-to-bill ratio above 1.0 indicates growing backlog and demand, while below 1.0 warns of potential future revenue slowdown.
- Accurate calculation relies on consistent definitions of bookings and billings, including normalization of multi-year contracts and timing of revenue recognition.
- Using a three-month moving average helps smooth out monthly fluctuations and reveals true demand trends more reliably than single-month ratios.
- Analysts should cross-check the ratio with backlog movement, order-to-cash metrics, and sector benchmarks to validate demand signals.
- Discrepancies between reported bookings and actual delivery performance can distort the ratio, making forensic disclosure analysis essential for reliable assessments.
Table of Contents
- How to Calculate the Book-to-Bill Ratio
- What Does a Book-to-Bill Ratio Above or Below 1.0 Mean?
- Where Book-to-Bill Analysis Goes Wrong
- How Analysts Use Book-to-Bill for Forecasting and Planning
- A Worked Example With a Three-Month Moving Average
- Turning the Analysis Into a Repeatable Process
- Validating the Signal With Forensic Disclosure Analysis
- Priorities for Analysts Running This Review Monthly
- Add Forensic Context to Your Book-to-Bill Reviews
- Sources
- FAQ
How to Calculate the Book-to-Bill Ratio
The formula is straightforward: Book-to-Bill Ratio = Total Bookings ÷ Total Billings, calculated over identical, aligned periods (monthly or quarterly, never mismatched).
Getting a usable number requires discipline on definitions, not just arithmetic.
- Define bookings as the signed contract value recognized in the CRM or contract system for that period, net of cancellations and downgrades.
- Define billings as recognized or invoiced revenue for the same period, drawn from the general ledger or billing system.
- Normalize multi-year contracts. Decide up front whether bookings reflect total contract value or annualized value, and apply that rule consistently.
- Divide bookings by billings for the period.
A short example: a company books new contracts worth significantly more than its recognized revenue in the same month, resulting in a book-to-bill ratio above 1.0, meaning demand is running ahead of what is being invoiced.
What Does a Book-to-Bill Ratio Above or Below 1.0 Mean?
A ratio consistently above 1.0 signals expanding backlog and rising demand. A sustained reading below 1.0 is a leading indicator of financial trouble, since backlog is depleting faster than new orders can replace it. A ratio at or near 1.0 suggests bookings and billings are roughly balanced, a common steady-state for mature businesses with predictable demand.
Context matters more than the raw number:
- 1.0 is the conventional baseline, but "healthy" varies by sector. A $1 million-booking, $800,000-billing month produces a 1.25 ratio, which reads as strong growth in most industries but as ordinary in project-based businesses with long sales cycles.
- A single month rarely tells the full story. One large multi-year contract can push the ratio well above 1.0 without reflecting a genuine demand shift.
- Extremely high ratios can strain fulfillment capacity, signaling operational risk rather than pure opportunity.
- Backlog movement should track the ratio. A rising book-to-bill with flat or shrinking backlog points to a data or timing problem worth investigating before drawing conclusions.
Where Book-to-Bill Analysis Goes Wrong
The ratio is only as reliable as the definitions feeding it, and definition drift is the most common failure point. Sales teams and finance teams frequently disagree on when a "booking" occurs, whether gross or net of cancellations, and how multi-year deals should be counted, and unresolved disagreement produces a number nobody trusts.
- Booking timing disputes between sales (deal signed) and finance (contract fully executed and revenue-recognizable) can shift a ratio by a full reporting period.
- Cancellations, returns, and renegotiated multi-year deals distort both the numerator and denominator if they aren't reconciled the same way each period.
- Revenue recognition timing is a known manipulation vector; shifting billing dates forward or backward can flatter or depress the ratio without any change in underlying demand.
- Seasonality and monthly noise routinely masquerade as trend. A single strong or weak month says little on its own.
Pro Tip: Never evaluate book-to-bill on a single month. Build a rolling three-month moving average before drawing any conclusion about demand direction, and always cross-check the trend against backlog movement, not just the ratio itself.
Reconciling bookings against recognized revenue in the general ledger is not a one-time exercise. Documented reconciliation rules between CRM bookings and revenue systems are the control that keeps the metric honest quarter over quarter.
How Analysts Use Book-to-Bill for Forecasting and Planning
Book-to-bill earns its place on an analyst's dashboard because it behaves as a leading indicator, arriving weeks or months before the revenue line moves. Its main uses fall into a handful of recurring decisions.
- Short-term revenue forecasting. A rising trend suggests billings will climb in coming periods as backlog converts to revenue.
- Capacity and staffing decisions. Sustained readings above 1.0 for two or more quarters often justify hiring, capital expenditure, or outsourcing to keep fulfillment aligned with demand.
- Backlog monitoring. Book-to-bill and backlog should move together; divergence between the two flags a data integrity issue or a genuine shift in deal composition.
- Cross-checks against order-to-cash KPIs. APQC recommends pairing book-to-bill with days sales outstanding (DSO), perfect order performance, and on-time delivery to confirm that fulfillment and collections quality aren't masking a weaker underlying signal.
- Escalation triggers. A ratio below 1.0 for two consecutive quarters, or a sudden drop of 15 to 20 percentage points month over month, warrants a conversation with sales operations before it reaches guidance.
Revenue-bridge analysis, which separates new business, expansion, contraction, and churn, helps explain what is actually driving a book-to-bill shift rather than leaving analysts guessing at the cause.
A Worked Example With a Three-Month Moving Average
Raw monthly ratios can whipsaw. Smoothing with a three-month moving average filters out timing noise and gives a cleaner read on direction. Consider a hypothetical software company over five months:
The 3MMA climbs steadily from 1.09 to 1.12 despite a dip to 0.90 in April, which is the point of smoothing: April's weak monthly ratio would look alarming in isolation, but the trend confirms demand is still expanding. An analyst reading only the April figure might flag a slowdown that the three-month view shows isn't there.
Turning the Analysis Into a Repeatable Process
Getting from raw exports to a dashboard analysts can trust requires clean sourcing and consistent rules, not just a spreadsheet formula.
- Pull bookings from the CRM or contract management system and billings from the ERP or billing platform, never from a single blended export.
- Apply one documented normalization rule for cancellations and multi-year deals, and apply it identically every period.
- Build dashboards around the 3MMA trend line, not the raw monthly figure, with automated alerts when the ratio crosses 1.0 in either direction.
- Reconcile bookings-to-billings monthly against the general ledger to catch definition drift before it compounds across quarters.
- Track upstream quote-to-cash metrics like quote accuracy and time-to-bill, since delays there distort billings and mask the true ratio.
Pro Tip: Automate the reconciliation between CRM bookings and GL revenue as a monthly control, not a quarterly cleanup project. Drift caught in month one is a rounding error; drift caught in month six is a restated forecast.
Analysts who want a structured checklist for spotting recognition inconsistencies before they reach the ratio can work through this revenue red-flag review.
Validating the Signal With Forensic Disclosure Analysis
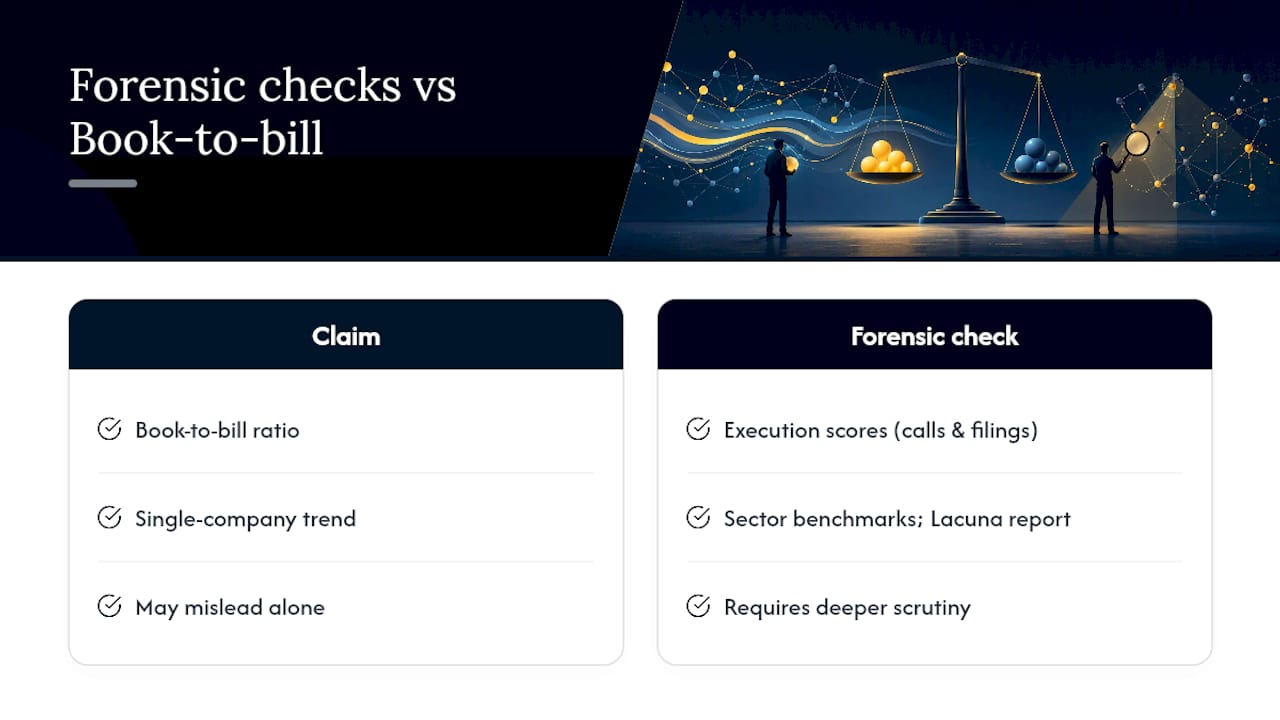
A rising book-to-bill ratio doesn't confirm durable demand on its own. Sector benchmarks and disclosure mining, the core of forensic analytics, test whether the narrative behind the number holds up against actual delivery. A company reporting strong bookings while showing weak execution scores across earnings calls and filings deserves closer scrutiny before that ratio drives an investment or governance decision. Reviewing sector benchmarks and consulting the Lacuna report guide helps place a single company's trend against how its peers are actually performing, not just what they're claiming.
Priorities for Analysts Running This Review Monthly
Run the 3MMA before reacting to any single month, and always reconcile bookings against the general ledger, not just the CRM export. Escalate to operations or investor relations only after two consecutive periods confirm the trend, not one. Cross-check every book-to-bill reading against backlog movement, DSO, and, where available, forensic execution data. The ratio is a signal, not a verdict.
— Glen
Add Forensic Context to Your Book-to-Bill Reviews
A rising book-to-bill ratio tells you demand is building. It doesn't tell you whether the company reporting it has a track record of turning bookings into delivered results, and that gap is where most misreadings happen. The gap is addressed by scoring public companies on how consistently their disclosed claims match what they actually deliver, using only public filings, earnings calls, and proxy statements.

Start with the free sector benchmarks to see how a company's book-to-bill trend stacks up against its sector median, then use the user guide to learn how execution scores flag companies whose bookings growth isn't backed by delivery history. Check the benchmarks for your sector before your next quarterly review.
Sources
For deeper technical grounding, consult AccountingTools on book-to-bill mechanics, APQC's O2C KPI framework, and SEMI's sector-level book-to-bill data for semiconductor benchmarking.
- Book-to-bill ratio — AccountingTools
- The ABCs of order-to-cash (O2C) — APQC
- Book-to-bill definition — Investopedia
FAQ
What Is a Healthy Book-to-Bill Ratio?
A ratio at or above 1.0 is generally considered healthy, signaling that new bookings are keeping pace with or exceeding billed revenue. What counts as strong varies by sector, so compare against industry norms rather than a fixed number.
How Do You Calculate the Book-to-Bill Ratio?
Divide total bookings by total billings for the same period: Book-to-Bill = Bookings ÷ Billings.
What Does "Book-to-Bill" Mean?
It measures the relationship between new orders received (booked) and revenue recognized (billed) in a given period, functioning as a leading indicator of demand direction and backlog change.
What Are the Main Financial Records Used to Track Bookings and Billings?
Bookings typically come from CRM and contract management systems, while billings are pulled from the ERP or general ledger. Reconciling these two sources consistently each period is essential to a reliable ratio.
Does Lacunaindex Provide Book-to-Bill Data?
Lacunaindex doesn't calculate the ratio directly, but its sector benchmarks and execution scores help analysts judge whether a company's bookings trend is backed by a credible delivery record.