
What are annual report discrepancies in equity research?
Annual report discrepancies, formally termed material inconsistencies in financial reporting, represent measurable gaps between audited financial statements and the accompanying corporate disclosures that analysts rely on for equity research. These gaps directly compromise the reliability of earnings per share calculations, cash flow assessments, and balance sheet reconciliations, creating mispricing risk that conventional valuation models rarely capture.
Key areas where discrepancies most frequently distort equity research include:
- EPS inconsistencies: Divergences between reported and analyst-inferred earnings per share, often caused by inconsistent treatment of special items across disclosure documents
- Cash flow misclassification: Operating cash flow conclusions unsupported by the actual statement of cash flows, sometimes substituted by mislabeled earnings measures
- MD&A versus financial statement conflicts: Revenue figures or performance narratives in management discussion sections that contradict audited financials
- Non-GAAP to GAAP bridges: Adjusted earnings presentations that cannot be traced cleanly to disclosed line items
- Balance sheet dating mismatches: Leverage or liquidity ratios referencing balance sheet figures from misaligned classification dates
US regulatory frameworks governing detection include PCAOB Auditing Standard AS 2710 and SEC Staff Accounting Bulletin Topic 1.M (SAB 99), which together require both qualitative and quantitative materiality assessments before any corrective action is determined. Forensic analytics operationalizes these standards by quantifying the aspiration-to-execution gap: the distance between what a company claims and what its public records actually confirm.
How does the US regulatory framework govern discrepancy reporting?
The US framework establishes a tiered response architecture that distinguishes error severity and mandates specific corrective actions accordingly.
- PCAOB AS 2710 requires auditors to notify management and governance bodies when material inconsistencies between audited financials and accompanying documents remain unresolved. Where management declines to correct a material discrepancy, the auditor must modify the audit opinion, potentially issuing a qualified or adverse report.
- SAB Topic 1.M materiality assessment mandates that SEC registrants evaluate errors using both the "iron curtain" method (current period impact) and the "rollover" method (cumulative prior-period impact) before classifying a discrepancy.
- "Big R" restatements apply when errors are material to previously issued financial statements, requiring the filing of amended reports and explicit "as restated" labeling on affected financial statement columns.
- "Little r" revisions address immaterial errors corrected prospectively, without requiring previously issued auditor reports to be withdrawn. Revised financial statements must not carry "as restated" labels, preserving reliance on prior filings.
- Michigan AFS standard: At the state level, frameworks such as the Michigan Annual Financial Statement mandate reporting all discrepancies regardless of dollar amount, with no materiality threshold, illustrating how sub-federal standards can exceed federal minimums.
Restatement classification matters. Distinguishing "Big R" from "Little r" is critical for institutional investors because it directly informs the severity and materiality of financial reporting issues over time, shaping risk assessments and position sizing decisions.
How do forensic analysts detect and quantify discrepancies in annual reports?
Detection methodology begins at the input level, not the conclusion. Financial statement reconciliation best practice requires verifying that every income statement figure reconciles to cited filings, that cash flow conclusions are supported by the actual statement of cash flows, and that balance sheet references match the classification date actually cited.
Core detection steps:
- Cross-statement reconciliation: Verify that income statement inputs, cash flow conclusions, and balance sheet references are internally consistent across all three primary financial statements.
- Per-share consistency audit: Identify whether EPS discussion uses diluted share counts in one section and basic share counts in another without explanation, a common supervisory defect.
- MD&A cross-validation: Compare revenue figures, margin narratives, and operational highlights in the MD&A against audited financials to surface conflicting explanations.
- Non-GAAP bridge tracing: Assess whether an analyst's bridge from reported earnings to adjusted earnings can be traced cleanly to disclosed items, or whether adjustments are applied inconsistently.
- Earnings triangulation: Compare EPS data from aggregators such as I/B/E/S against earnings inferred from management guidance and analyst forecasts to expose measurement errors. EPS data gaps appear in 36.5% of cases, even when only one analyst follows a firm.
- Assumption validation: Challenge the weakest assumption in any model rather than accepting a sophisticated narrative at face value. Effective supervisory review targets the weakest link, whether a data source or a modeling assumption, rather than rewriting the report from scratch.
- Filing-date mismatch check: Identify when restated financials, amended filings, or filing-date mismatches require a full reconciliation update before any approval.
Pro Tip: Start every forensic review from the input, not the conclusion. Identify where each important number originated, whether it is labeled correctly, and whether it reconciles across tables, narrative sections, and per-share metrics before evaluating the investment thesis.
How does forensic analytics improve equity research quality?

Forensic analytics converts qualitative disclosure opacity into quantifiable accountability scores, giving institutional investors an objective basis for comparing corporate narrative claims against actual delivery. Lacunaindex operationalizes this by mining earnings calls, SEC filings, press releases, and proxy statements to quantify claim-versus-delivery gaps without requiring insider access.
The platform classifies companies into three archetypes based on execution scores and valuation metrics:
| Archetype | Execution Score Profile | Valuation Signal |
|---|---|---|
| Earned | High delivery relative to narrative claims | Valuation supported by demonstrated performance |
| Borrowed | Elevated narrative relative to actual delivery | Mispricing risk; restatement signal elevated |
| Undervalued | Delivery exceeds narrative claims | Potential upside; disclosure opacity suppressing price |
Systematic non-GAAP versus GAAP analysis sits at the core of this methodology. Aggressive non-GAAP adjustments that recur across multiple periods without clear operational justification are a primary indicator of engineered disclosure. Forensic analytics also complements traditional discounted cash flow and relative valuation techniques by surfacing hidden risks that standard models treat as noise, particularly where restatement classifications and forensic scores indicate deteriorating historical reliability.
What accounting anomalies most affect annual report consistency?
Several recurring anomaly types generate persistent distortions in annual report reliability and downstream equity research accuracy.
- Accrual anomaly: Firms with high accruals relative to cash earnings tend to underperform, a pattern that challenges conventional pricing models because it is difficult to distinguish rational risk pricing from genuine market mispricing.
- Post-earnings-announcement drift (PEAD): Return patterns following earnings announcements persist longer than standard one-period models predict, suggesting the market systematically underreacts to earnings information embedded in annual disclosures.
- Analyst forecast errors linked to accruals: Accrual-related forecast errors are driven primarily by product-market shocks rather than by analysts misunderstanding accounting principles, meaning errors span multiple years and are most pronounced during periods of external economic disruption.
- Report inconsistency as a quality metric: Inconsistency in analyst reports correlates with forecast complexity and analyst independence, with inconsistent reports exhibiting statistically higher forecast errors and stronger short-term price reactions.
- Non-GAAP versus GAAP divergence: Persistent and widening gaps between adjusted and GAAP earnings signal potential earnings management, eroding the comparability that institutional investors depend on for cross-company analysis.
Notable cases of annual report discrepancies in US companies
Several high-profile US cases illustrate how annual report discrepancies migrate from disclosure failures into material market events. General Electric's multi-year restatement process, which culminated in a $6.2 billion insurance reserve charge disclosed in January 2018, exposed a sustained gap between management's narrative on long-term care liabilities and the actual actuarial position embedded in audited financials. The discrepancy had persisted across multiple annual reports before auditors and regulators required correction.
Luckin Coffee, though a Chinese-listed company with US-traded ADRs, demonstrated how fabricated transaction data in operational disclosures can remain undetected through standard audit procedures until forensic analysis of point-of-sale records exposed a gap between reported revenue and actual sales volume. The SEC's subsequent enforcement action underscored that disclosure consistency across filings is a necessary condition for audit reliability, not a supplementary check.
Wirecard's collapse, while a German-listed entity, prompted US institutional investors to reassess how cash balance confirmations in annual reports can be engineered through third-party custodian structures, leaving a material discrepancy between reported and actual liquid assets undetected for years. Each of these cases shares a common forensic signature: the gap between narrative claims and quantitative delivery was visible in public records before formal restatement.
Step-by-step guide to conducting forensic analysis on annual reports
A structured forensic review of an annual report follows a defined sequence that prioritizes input integrity over narrative plausibility.
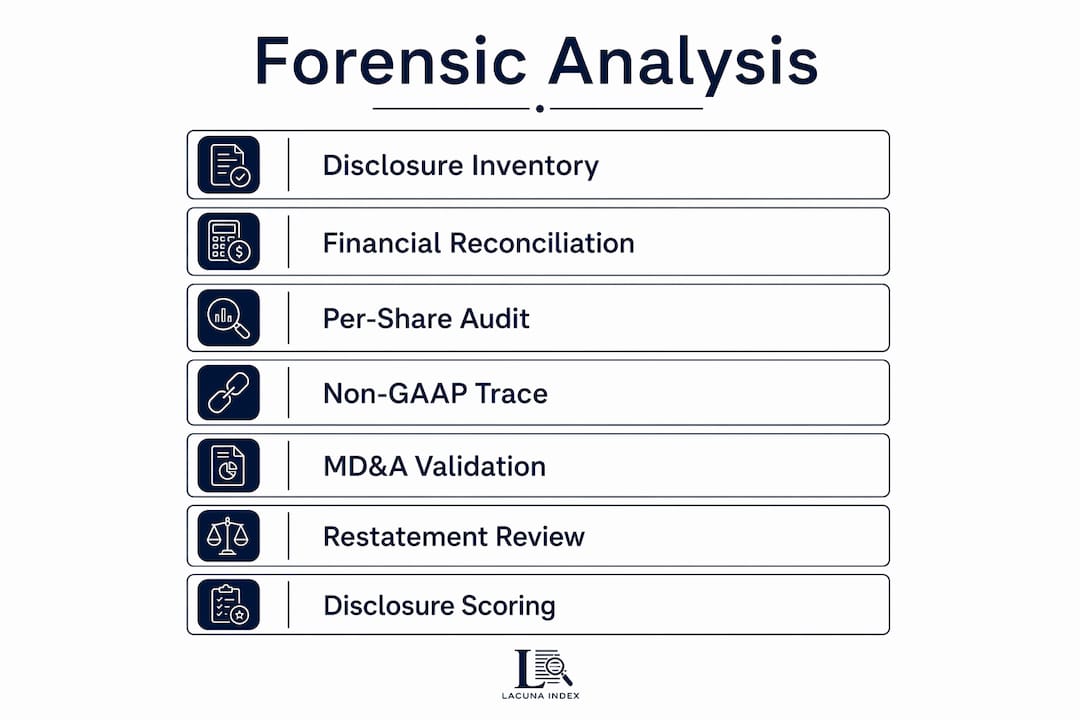
Step 1: Establish the disclosure inventory. Collect the 10-K, proxy statement, earnings call transcripts, and any press releases issued during the reporting period. These form the complete disclosure perimeter for cross-validation.
Step 2: Reconcile the three primary financial statements. Verify that net income flows correctly from the income statement to the cash flow statement, and that retained earnings on the balance sheet reflect the same figure after dividends. Any break in this chain is a primary forensic flag.
Step 3: Audit per-share metrics for consistency. Confirm that diluted share counts used in EPS calculations match those referenced in the MD&A and footnotes. Inconsistent share counts across sections indicate either a supervisory defect or deliberate obfuscation.
Step 4: Trace non-GAAP adjustments. Map every adjustment in the non-GAAP reconciliation table to a specific disclosed line item. Adjustments that recur annually, grow in magnitude, or lack operational justification warrant elevated scrutiny. Consult the forensic analysis methodology for a detailed walkthrough of this tracing process.
Step 5: Cross-validate MD&A claims against audited figures. Revenue growth narratives, margin improvement claims, and segment performance descriptions in the MD&A must be reconcilable to audited financials. Internal inconsistencies between MD&A narratives and quantitative financials are red flags for possible earnings engineering.
Step 6: Assess restatement history. Review prior-year filings for any "Big R" or "Little r" corrections. A pattern of recurring revisions in the same line items suggests a structural reporting weakness rather than isolated error.
Step 7: Score disclosure quality. Assign a qualitative rating to the overall disclosure based on completeness, internal consistency, and the degree to which footnotes explain rather than obscure. This score feeds directly into the execution assessment framework used by platforms such as Lacunaindex.
How to report and escalate discovered discrepancies within regulatory channels
When forensic review surfaces a material discrepancy, the escalation path depends on the analyst's institutional role and the nature of the finding. Internal escalation to a supervisory analyst or compliance officer is the first required step under FINRA rules for sell-side research. The supervisory analyst must determine whether the discrepancy constitutes a reportable defect before the research is approved for distribution.
For external escalation, the SEC's Office of the Whistleblower provides a formal submission channel for material misstatements in public company filings. Submissions that lead to enforcement actions resulting in sanctions exceeding $1 million may qualify for financial awards under the Dodd-Frank whistleblower program. Governance advocates operating within institutional frameworks should also notify audit committee members directly, as PCAOB AS 2710 places an affirmative obligation on auditors to communicate unresolved material inconsistencies to those charged with governance. Documenting the specific discrepancy, the source documents compared, and the reconciliation failure is prerequisite to any credible escalation.
What limits the effectiveness of current discrepancy detection methods?
Current methodologies face three structural constraints that forensic practitioners must account for explicitly. First, disclosure opacity is often by design. Companies operating within GAAP's permissible range can select accounting treatments that are individually defensible but collectively engineered to present a favorable picture, making it difficult to distinguish aggressive accounting from outright misstatement without access to internal records.
Second, aggregated accrual data from standard databases such as Compustat conflates heterogeneous accrual types with different GAAP measurement rules, creating an errors-in-variables problem that weakens the statistical power of accrual-based anomaly detection. Third, the timing gap between annual report publication and forensic review means that market prices often partially adjust before a discrepancy is formally identified and escalated, reducing the actionable window for institutional investors. Forensic analytics platforms that monitor corporate disclosure integrity continuously across filing cycles narrow this gap but cannot eliminate it entirely.
How do corporate governance and auditor responsibilities prevent discrepancies?
Audit committees bear primary governance responsibility for ensuring that management's accompanying disclosures are consistent with audited financial statements before publication. Effective audit committees review MD&A drafts against audited figures, challenge non-GAAP reconciliation tables, and require management to document the basis for any adjustment that deviates from prior-period treatment.
External auditors operate under PCAOB AS 2710's requirement to read all accompanying information and communicate identified inconsistencies to management promptly. Where management declines to correct a material discrepancy, the auditor's only recourse is a modified opinion, a qualified or adverse report that signals to the market that the financial statements cannot be fully relied upon. Internal controls over financial reporting, assessed annually under Sarbanes-Oxley Section 404, provide a second layer of prevention by requiring management and auditors to evaluate whether control deficiencies contributed to the discrepancy. Governance frameworks that treat annual report credibility as a board-level accountability metric, rather than a compliance checkbox, consistently produce lower rates of material restatement.
Lacunaindex quantifies what auditors and analysts often miss
Forensic review of annual reports requires more than identifying a single discrepancy. It requires a systematic, repeatable process that scores the gap between corporate claims and actual delivery across every material disclosure. Lacunaindex was built specifically for institutional investors and governance advocates who need that process applied consistently, without insider access, and grounded entirely in public records.

The platform's execution scores and sector benchmarks translate forensic findings into investment-grade accountability metrics, classifying companies as earned, borrowed, or undervalued based on quantified delivery gaps rather than narrative quality. For analysts conducting equity research report analysis, Lacunaindex surfaces the restatement signals, disclosure quality scores, and aspiration-to-execution gaps that standard financial models treat as unquantifiable. Access sector benchmarks and forensic scores to begin evaluating the companies in your coverage universe against objective delivery standards.
Key Takeaways
Annual report discrepancies distort equity research accuracy most severely when EPS treatment, non-GAAP adjustments, and MD&A narratives are not reconciled against audited financial statements using a structured forensic process.
| Point | Details |
|---|---|
| EPS data gaps are common | 36.5% of cases show divergence between I/B/E/S actual EPS and analyst-inferred EPS, directly reducing forecast accuracy. |
| Restatement classification drives risk assessment | "Big R" restatements require amended filings; "Little r" revisions do not, and conflating the two leads to mispriced reporting risk. |
| Forensic review starts at the input | Effective discrepancy detection begins with source validation and reconciliation across statements, not with evaluating the investment conclusion. |
| Analyst report inconsistency is measurable | Reports with greater internal inconsistency exhibit statistically higher forecast errors and stronger short-term market reactions, per 2025 research. |
| Lacunaindex scores the delivery gap | The platform classifies public companies as earned, borrowed, or undervalued using execution scores derived entirely from public disclosures. |